Mastering the Piercing Candlestick Pattern :
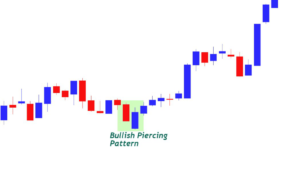
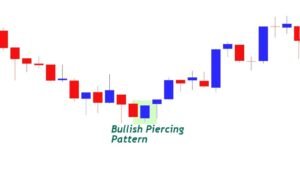
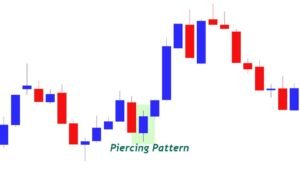
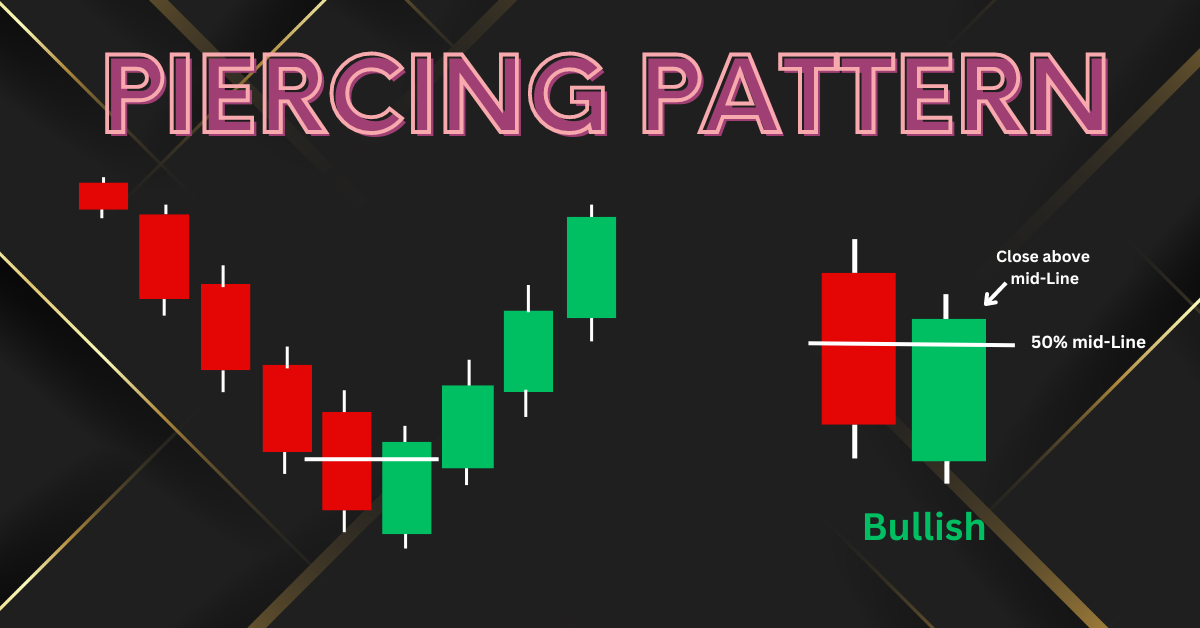
The Piercing Candlestick Pattern is a bullish candlestick reversal pattern best seen at the end of a downtrend. It consists of two candlesticks, first a long black (down) candle followed by an up-sloping white candle that opens lower than previous close but closes more than halfway into first candle’s body.
- This signal indicates shift from sellers to buyers suggesting potential price direction reversals and is therefore valuable tool for traders looking for opportunities in declining markets
- Candlestick patterns provide investors with insight into investor sentiment and potential future price movements, and piercing candlestick patterns serve as story tellers in the stock market.
- Telling a narrative of market dynamics that traders and analysts can use to make more profitable trades by understanding and using this pattern to illuminate charts, enabling more informed trading and ultimately more lucrative transactions.
- In this comprehensive guide, we’ll shed light on the historical importance of piercing candlestick patterns, provide practical strategies for their recognition and interpretation, and discuss its application across various trading markets.
- After reading this post, you will be prepared to utilize this powerful pattern as part of your trading arsenal.
Understanding Piercing Candlestick Patterns :
Piercing candlestick patterns serve as bullish reversal signals when they occur at the bottom of a downtrend.
- Consisting of two candlesticks one depicting bearish trending, followed by one suggesting bullish reversal is likely.
- They’re typically distinguished by having one large red (or black) candle on day 1, followed by another green or white one which opens below its low but closes halfway into its prior candle’s real body on day 2, they make an excellent bullish reversal signal at any point within a down trending trending market.
- The pattern depicts a market opening lower, then rapidly rising as bulls gain strength during trading to close significantly higher, typically by midway or more into its previous bearish candle’s body. Such an occurrence indicates a likely change in trend to an upward one.

The Anatomy of a Piercing Candlestick for further discussion :
- Red/Black Candle: The initial day of this pattern shows strong bearish momentum, typically with a long real body and short upper wick.
- Upper Wick : Any additional upper wick indicates the market’s attempt to push prices higher but was met with resistance from bearish pressure.
- Lower Wick: When present, this signal indicates an attempt by bulls to gain ground but were unsuccessful in doing so.
- Green/White Candles: These appear when there is a gap down at the start of trading on day 2, only for it then to reverse course and close near its high of day 1.
- Reversal Significance: At the close of day 2, losses have significantly declined from their peak on day 1, suggesting an increasing likelihood that trend might switch back up again.
Historical Analysis of the Piercing Candlestick Pattern :
- The piercing candlestick pattern dates back to feudal Japan rice markets.
- The piercing candlestick pattern has proven itself as an indispensable tool in technical analysis, providing insightful and actionable analysis that has contributed to numerous traders’ successes.
Case Studies :
- Historical Analysis of Piercing Patterns Microsoft and Amazon stocks have historically displayed this bullish reversal pattern prior to significant price movements.
- Often signaling favorable buying opportunities before significant price jumps occur in some instances even before substantial upticks occur making this an effective indicator for profitable trading strategies for astute investors.
Navigating the Forex Market :
- Piercing candlestick patterns have proven their worth in the unpredictable world of Forex trading.
- Such as when EUR/USD and USD/JPY currencies exhibit them before experiencing upward market corrections that signal that prior downtrend may be over and offer traders an opportunity to go long and benefit from any expected upticks in currency values.

Recognizing and Interpreting the Piercing Candlestick Pattern :
Acknowledging piercing candlestick patterns amongst all of the candles on a chart requires practice and an experienced eye, so here is a step-by-step guide on recognizing and interpreting it:
Step 1: Spot the First Candle :
- To identify a bearish daily candle with a significant “real body” and short wick, as the more prominent and distinct its downward movement may be the more reliable the pattern may be.
Step 2: Examining the Second Candle :
- To accurately gauge market sentiment, the following day’s candle should open lower than its previous close, demonstrating downward pressure in the market sentiment.
- Furthermore, its trading should move lower; ideally below the midpoint of its preceding bearish candle so as to continue bearish momentum.
Step 3: Final Confirmation :
- To verify a true piercing pattern, the second day’s candle must reverse direction and close above the midpoint of the prior day’s candle signalling significant buying pressure and potential trend reversal.
Interpreting the Strength of a Pattern :
- A significant second day candle indicates an increasing likelihood of bullish reversal, while its larger real body size and volume support its reliability.
- Traders must remain mindful of the general market trend, keeping an eye out for piercing patterns at support levels to identify potentially powerful signals.
Avoid Common Mistakes When Trading Candlestick Patterns :
Mistakes when interpreting candlestick patterns can be costly. Common pitfalls to be wary of in candlestick analysis include.
- Misreading Context: Context is essential when viewing patterns within candlestick analysis patterns should not be seen in isolation but should rather be evaluated alongside other technical indicators and market movements.
- Chasing Outliers: Recognizing and capitalizing on piercing patterns are crucial, yet conducting further analyses should never simply follow them blindly.
- Over trading: Engaging in too many trades solely based on candlestick patterns can result in high transaction costs and diminish potential profits.

Incorporating the Piercing Candlestick Pattern Into Your Trading Strategy :
Once identified, how can the piercing candlestick pattern be integrated into a trading strategy?
Confirmation and Timing :
- Utilizing other technical indicators or waiting for additional bullish price action will help confirm and time your trades based on this pattern.
Establish Stop Losses and Profit Targets :
- Set stop-loss levels based on your risk tolerance and market volatility; similarly, establish profit targets based on how far upward movement you expect.
Trading Volume :
- An increase in trading volume on the second day after a piercing pattern only strengthens its reliability further.
Tips for Continuous Learning and Adaptation :
- Continuous learning and adaptation are critical in the volatile trading environment.
- Stay abreast of market news and economic reports that could impact your trading. Also practice on a demo account while examining both successful and unsuccessful trades to hone your skills further.
Conclusion :
The piercing candlestick pattern serves as a beacon in the murky waters of trading analysis, offering clarity in terms of bullish reversal signals.
- While not 100% accurate, when coupled with sound trading strategies it can mark the start of a profitable trade traders who learn how to recognize and interpret this pattern will take one step closer towards unlocking their true trading prowess.
- As you progress on your trading journey, remember that understanding the power of piercing candlestick patterns is only one milestone on the road to informed and successful trading.
- With every trade and chart you analyze, your knowledge grows. With each new experience comes another chance for improvement and refinement. Keep learning, adapting, and may the piercing candlestick pattern be your guide towards financial success.

Frequently Asked Questions :
1. What Is A Piercing Candlestick Pattern?
Answer :
- A piercing candlestick pattern is a two-day bullish reversal pattern found in downtrend markets that indicates market sentiment may be shifting from bearish to bullish.
2. How Can I Recognize Piercing Candlestick Patterns?
Answer :
- To identify piercing patterns, look for long bearish candles accompanied by long bullish ones; each should open below its respective closing price but close within its real body of the previous candle.
3. Is the Piercing Candlestick Pattern Reliable for Predicting Upward Trends?
Answer :
- While the Piercing Candlestick Pattern can provide early indicators of potential bullish reversals, its reliability increases when confirmed by other technical indicators or significant volume increases.
4. Can the piercing pattern be applied across different markets, including stocks, forex and commodities?
Answer :
- Yes, its application spans across markets including stocks, forex and commodities; its interpretation may change slightly based on market volatility or asset being traded.
5. What are some common mistakes associated with trading using the piercing candlestick pattern?
Answer :
- Common errors include disregarding market context, over relying on patterns without seeking independent confirmation from other analysis tools and failing to implement proper risk management controls such as stop losses and take profit levels.


