The Triple Bottom Pattern – A Complete Guide for Traders
- Our thorough guide will help you to recognize and trade the Triple Bottom Pattern.
- To improve your decision-making process, find important components, see trends on stock charts, and apply successful trading techniques.
Introducing the Triple Bottom Pattern :
- A strong chart form indicating a possible turnaround in a downtrend is the Triple Bottom Pattern Celebrated in technical analysis, this pattern provides traders with a consistent approach to spot and profit on trend reversals.
- Understanding the Triple Bottom Pattern helps traders to better decide what to do and modify their trading plans.
Learning the Triple Bottom’s Mechanisms :
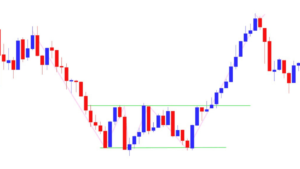
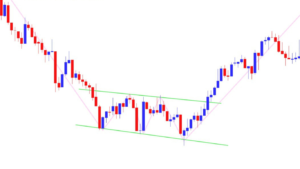
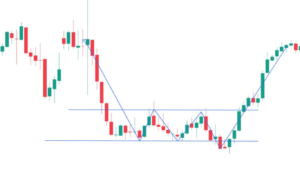
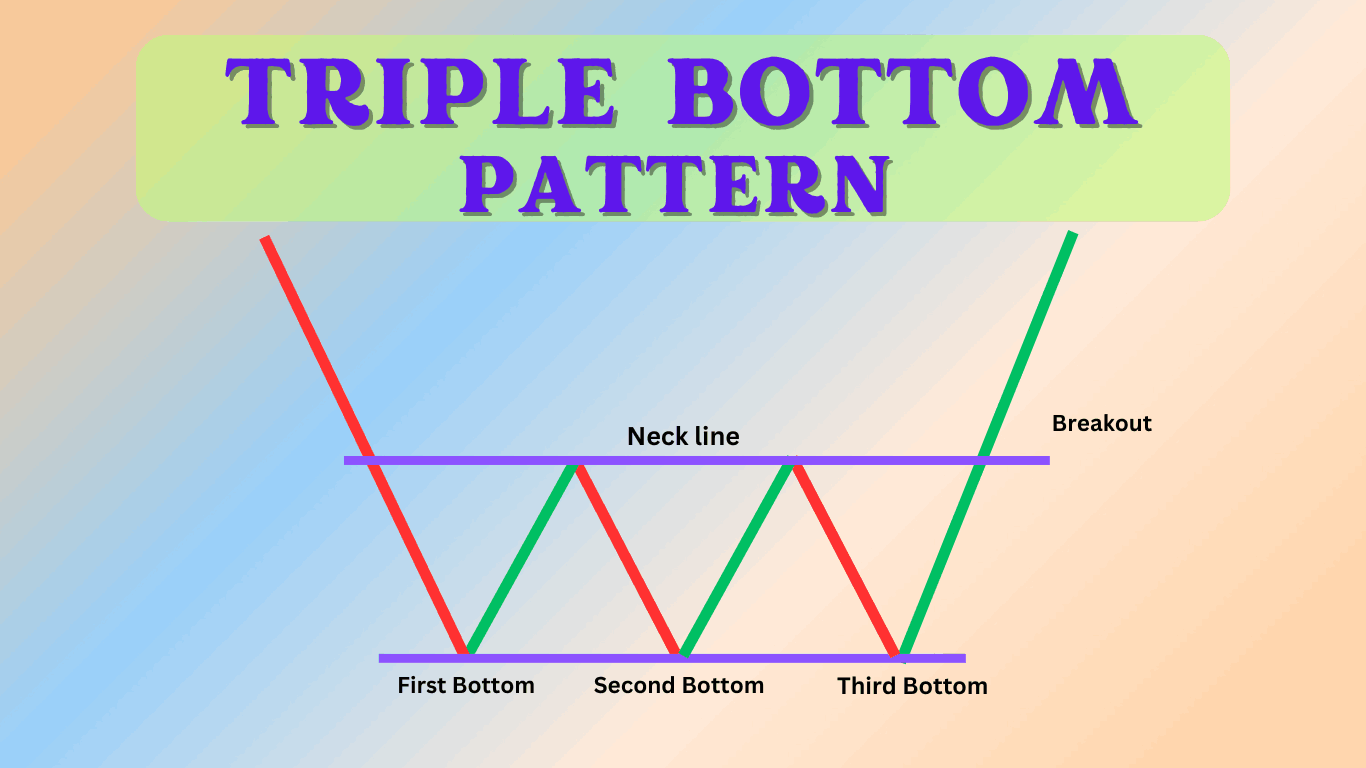
- When an asset’s price strikes the same support level three times and two minor rallies in between, a triple bottom pattern results.
- Three quite equal-priced troughs that indicate solid support at that level define this pattern. The main elements to search for consist in:
Three Parallel Lows :
Three distinct times, the price should reach a similar low position demonstrating a constant degree of support over a period.
Intervening Highs :
- Intervening highs between these low points should be two different highs or peaks that enable a clear pattern to develop.
Breakout Confirmation :
- Confirmation depends on a breakout over the resistance level created by the highs since it indicates a possible change in market momentum and the start of a new upward trend.

Identifying the Triple Bottom Patterns :
- Identifying the Triple Bottom Pattern on stock charts needs both thorough grasp of the pattern’s features and sharp observation.
These are some pointers and methods:
Use Multiple Time Frames :
- Examine the trend’s validity and obtain a whole picture of its strength and direction by looking at daily, weekly, and monthly charts among other time frames.
Volume Analysis :
- Look for growing volume on the breakouts since this supports the strength of the pattern.
- More volume suggests more traders’ confidence and interest, thereby giving the breakout more credence.
Indicator Support :
- To confirm the triple bottom pattern, use technical indicators such as Moving Average Convergence Divergence (MACD) or Relative Strength Index (RSI).
- These signals provide further evidence for your study by helping you to spot momentum and possible reversals.
Triple Bottom Pattern in Action :
1- case study: Apple Inc.,
- Here we will examine Apple’s stock chart for a Triple Bottom Pattern. Over six months, the stock price three times over reached the $150 support level.
- With rising volume after the third bottom, the price broke above the $160 barrier mark and underwent a notable rally.
2- case study is EUR/USD Forex Pair.
- At the 1.1000 level the daily EUR/USD chart showed a Triple Bottom chart Pattern.
- The price broke the resistance at 1.1500 following the third touch, giving forex traders unambiguous trading signals.
3- case study: gold (X AU/USD) commodity market
- About the $1700 mark, gold prices created a Triple Bottom Pattern.
- For those in the business of commodities, the breakout above $1800 offered a great starting point for large profits.

4- case study: Tesla Inc.
- Triple Bottom chart Pattern showed on Tesla’s stock chart; but, the breakout failed and produced a misleading signal.
- This case study stresses risk management and confirmation’s need.
5- Case Studies: S&P 500 Index
- A Triple Bottom Pattern on the S&P 500 index chart offered a more complete market study perspective.
- Around 4000 points, the pattern developed; the breakout marked the start of a positive trend in the market.
Possible Errors and Their Prevention :
Although the Triple Bottom Chart Pattern is consistent, traders have to be careful of the dangers:
False Outbreaks :
- Verify by volume and other signs. Use extra tools and signals for validation since false breakouts can mislead traders into believing a trend reversal has happened when none has.
Ignoring Time Limits :
- To prevent misleading signals, validate the trend over several time frames—from daily to weekly charts.
- Different temporal horizons can offer a more complete picture and support more informed judgments.
Overlooking Market Conditions:
- Before deciding what to trade, go through more general market trends and conditions.
- The Triple Bottom Chart Pattern’s effectiveness and market behavior can be affected by outside events including world affairs and economic news.
- Traders can increase their possibilities of effectively applying the Triple Bottom Pattern in their trading plans by avoiding these traps.

Triple Bottom Pattern in Various Market Systems :
Applied throughout a range of markets, the flexible technical analysis tool the Triple Bottom Pattern is:
Stock Market :
- After three separate lows, this pattern helps traders spot possible reversals in individual stock values, therefore indicating an increasing trend.
Forex Market :
- The Triple Bottom Pattern offers information on when a currency might strengthen after reaching a steady low point three times, thereby helping one to forecast moves in currency pairs.
Commodity Market :
- Traders can also use this pattern on commodities such gold and Crude oil to identify possible trend reversals and guide their choice of when to start or stop trading.
Understanding and applying the Triple Bottom Chart Pattern can help traders to better negotiate several markets and strengthen their trading techniques.
Strategies for Trading Triple Bottom :
Considering these techniques will help you trade the Triple Bottom Pattern:
Entry Points :
- Entry points for trades are verified breakouts over the resistance level.
- Verify the breakout using further volume and then wait for a retest of the breakout level for further security.
Exit Points :
- Profit goals should be based on previous resistance levels, employ trailing stops to lock in gains as the price keeps rising.
- Think about half profit-taking at intermediate resistance levels.
Risk Management :
- Minimizing losses requires stop-loss orders below the low of the pattern.
- As the deal advances, change your stop-loss to guard your capital. Before you start the transaction, make sure your risk-to—reward ratio is positive.
Conclusion :
- Including the Triple Bottom Chart Pattern into your trading plan will help you much improve your capacity to spot and profit from trend reversals.
- Understanding the mechanics of the pattern, seeing it on charts, and using sensible trading techniques will help traders raise their odds of success.
- Always validate the pattern using volume and indicators, keep in mind more general market conditions to help you stay clear of possible hazards.

Frequently Asked Questions :
What is the Triple Bottom Pattern?
Answer :
- When the price of an asset strikes the same support level three times, separated by two modest rallies or highs, the Triple Bottom Pattern—a bullish reversal pattern—forms.
- It implies that the asset has attracted great support and that once the price crosses the level of resistance set by the intervening highs, a trend reversal might start.
How can I identify a Triple Bottom Chart Pattern?
Answer :
- Look for increasing trading activity on the breakout over the resistance level created by the intervening highs to verify a Triple Bottom Pattern.
- Further evidence of the validity of the pattern can come from applying technical indicators as the Relative Strength Index (RSI) or Moving Average Convergence Divergence (MACD).
Can the Triple Bottom Pattern Fail?
Answer :
- Indeed, the Triple Bottom Chart Pattern might fail and produce a false breakout just as any trading pattern might.
- Using technical indicators and volume analysis among other confirmation methods helps reduce false signal risk.
- Moreover, using risk-reducing techniques as stop-loss orders helps guard against possible losses.
What kinds of markets can use the Triple Bottom Pattern?
Answer :
- Applied to many financial markets, including the stock, Forex, and commodities markets, the Triple Bottom Chart Pattern is adaptable.
- It is used to spot possible trend reversals in equities, currency pairs, commodities including gold and oil, and asset markets generally.
How long does it take for a Triple Bottom Chart Pattern to show up?
Answer :
- The asset and the state of the market will greatly affect the time needed for a Triple Bottom Pattern to develop.
- It could develop over a few weeks or even several months.
- Examining the trend over several time periods helps one to see its growth and possible breakout timing from a more distinct angle.
What are the best ways to trade the Triple Bottom Chart Pattern?
Answer :
- Trading the Triple Bottom Pattern using effective tactics includes starting trades on confirmed breakouts above the resistance level, basing profit goals on past resistance levels, and applying trailing stops to lock in winnings.
- Using stop-loss orders below the low of the pattern can also help to reduce possible losses and improve general trading performance.


