The Bullish Flag Pattern : A Complete Guide for Traders
Financial market observers who understand its inner workings have become adept at deciphering charts for patterns, which reveal a secret language rooted in stocks, forex, and cryptocurrency markets.
The fundamentals of the Bullish Flag Pattern to craft successful trading strategies. Master this powerful technical analysis tool across stocks, forex, and cryptocurrency markets by learning to identify, apply, and set targets using it.
Expand your risk management techniques while engaging with a community eager to share knowledge start mastering it today for informed trading decisions.
A key figure among these is the Bullish Flag Patterns, day traders, financial analysts, investors frequently come across this idiosyncrasy but what exactly is it indicating
Introduction to The Bullish Flag Pattern :
- Flagpole: To identify a bullish flag patterns, traders look for the following characteristics.
- Flag: Following the flagpole, prices enter into a period of consolidation in which they form rectangular patterns with parallel trend lines, signalling a temporary stop to their upward momentum.
- Trading Volume: As flags form, trading volumes tend to decline as market activity decreases and traders become more uncertain about market decisions and expectations.
- Breakout: When price breaks out above the upper trend line of the flag pattern, signaling its potential continuation, the bullish flag patterns can be confirmed as confirmed.
Trading the Bullish Flag Pattern :
Once traders recognize a bullish flag pattern, they look for potential entry and exit points to take advantage of anticipated price movements and make money off it. Here are some strategies commonly employed when trading this trend:
- Entry : When looking to enter long positions, traders often wait until price breaks above the upper trend line of a flag to do so, signalling potential continuation of bullish momentum. They might then wait for a retest of breakout level as an additional way of verifying strength of upward momentum.
- Stop-Loss : To mitigate risk, traders typically set a stop-loss order below either the lower trend line of a flag pattern or below its most recent swing low to protect themselves against potential downside risk in case its formation doesn’t materialize as anticipated.
- This helps shield investors against any possible downside risk should the pattern fail to take shape as expected.
- Target : Traders may set their target based on the height of a flagpole, estimating an increase equal to its distance in price following a breakout. This target provides a rough estimation of potential price gains after breakout occurs.
- Confirmation : Before taking action on any breakout signal, it’s essential to wait for confirmation that it is in fact valid. Doing this reduces false signals and confirms that a pattern exists.

Limitations of the Bullish Flag Pattern :
While the bullish flag pattern can be an invaluable way to identify buying opportunities in a bullish market, its use comes with certain limitations that traders should keep in mind when using this tool. Considerations include:
- False Breakouts: Not all bullish flag patterns result in the continuation of an upward trend; false breakouts may occur and lead to potential losses if traders enter positions too soon.
- Market Conditions: The bullish flag pattern’s efficacy can be determined by overall market conditions and economic factors, when using this pattern for trading decisions, it is crucial to take this into account.
- Risk Management: Like with any trading strategy, risk management is of vital importance when trading the bullish flag pattern. Traders must carefully consider their risk tolerance and position size to prevent excessive losses.
What Is a Bullish Flag Pattern?
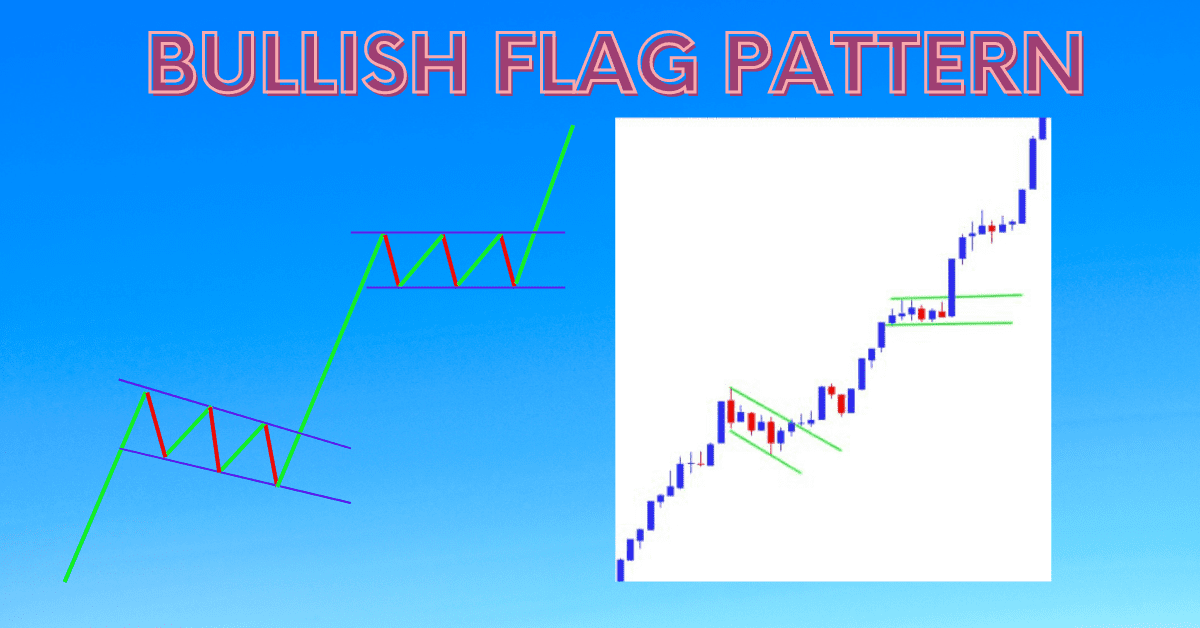
A Bullish Flag Pattern is a continuation pattern which often appears during mid-trend, signaling a temporary pause before market resumes its previous uptrend. It consists of two parallel trend lines flagpole (an upward move), and flag (an accumulation channel that slopes downward against primary trend).
Historical Context and Significance :
The Bullish Flag Pattern has long been recognized for its powerful predictive abilities.
Traders and analysts alike have relied on it for decades to anticipate bullish market movements, its form provides a visual representation of market psychology periods of consolidation followed by profit taking followed by renewed buying pressure.
How Can One Recognize Bullish Flag Patterns :
Once identified, Bullish Flag Patterns can easily be recognized. To do so simply refer back to step one below.
Key Indicators and Visual Representations :
A bullish flag patterns features an initial upward move (the flag pole), followed by a consolidation phase in which prices stay within two parallel lines (the flag).
Volume should decline during this stage before breaking free of it with increased volatility once reaching completion of this pattern.
Real-World Examples and Case Studies :
We will analyze real-world market scenarios to demonstrate the Bullish Flag Patterns using various tools such as moving averages, Relative Strength Index (RSI), volume analysis and historical case study analysis.
This method can accurately pinpoint this pattern with great precision. A historical case study analysis will give practical application of this approach.
Understanding the Psychology Behind Bullish Flags :

Market Dynamics and Participant Behavior :
A Bullish Flag signals a brief pause in market activity due to conflicting behaviors among participants. Buyers who witnessed the flagpole may take profit while new investors evaluate whether to join its uptrend before jumping in.
Factors Contributing to the Formation and Progression of Bullish Flag Patterns
Many internal and external forces play an essential role in shaping and perpetuating Bullish Flag patterns on the market, such as economic events, company specific news for stocks trading on an exchange, geopolitical developments influencing forex or crypto markets and geopolitical conflicts in these markets.
Analyzing Bullish Flag Patterns in Multiple Markets :
Application in Stock Trading, Forex and Cryptocurrency Markets.
While the fundamental principles of Bullish Flag Pattern remain the same across markets, its applications vary considerably and we’ll examine those with specific examples as we discuss how you should tailor your trading strategy accordingly for each one.
Variations and Adaptations across Different Financial Instruments.
The pattern’s reaction may differ based on financial instrument, liquidity and market conditions. We will examine variations such as flagpole size and duration as early indicators of market divergence. Strategies for Trading on Bullish Flag Patterns.
Entry and Exit Points :
Knowing when and how to enter or exit a trade based on this pattern is crucial.
We will discuss when to enter when price breaks out of its flag and approaches previous high, while exit when market shows signs of reversal.
In addition, we will cover contingencies like false breakouts as well as risk mitigation techniques.

Maximizing Profit Potential :
- The Bullish Flag Pattern’s predictive value extends far beyond signaling an uptrend continuation, we will discuss strategies to use this pattern profitably, such as trailing stops, pyramiding positions and setting profit targets based on flagpole height.
Demystifying the Bullish Flag Pattern for Modern Traders :
Decoding financial market patterns is like reading their secret language deciphering charts is like cracking open an ancient codebook of stocks, forex and cryptocurrency markets.
One such signature figure is known as the Bullish Flag Patterns an influential trend seen all throughout history.
Those wishing to expand their trading repertoire further are advised to explore additional resources, educational materials and engage with the trading community as ways to continue expanding.
Conclusion :
In conclusion, the Bullish Flag Pattern is an invaluable asset in any trader’s toolkit.
With its simple yet effective form and strong predictive power, many traders rely on this pattern for profitable trades across various financial markets.
By understanding its dynamics, identifying it accurately, and employing effective strategies you can tap its potential for profitable trades across various financial markets so keep an eye out for this pattern when doing your chart analysis and see your trading game improve significantly.
As traders and investors gain more familiarity with the Bullish Flag Patterns, they now possess another tool in their arsenal for making more informed decisions and remaining one step ahead in the market.
Remember,experience is the best teacher, allocate some time each day to identify these patterns on charts so you can become proficient at using technical analysis for successful trading.

Frequently Asked Questions (FAQs)
What Is the Bullish Flag Pattern?
Answer :
- A Bullish Flag Pattern is a chart formation that indicates an uptrend is continuing, typically by showing two sharp upward movements separated by an intermediate consolidation phase known as “flagpoles,” followed by narrow consolidation periods in between (the flag).
- Often this pattern moves against its trend in nature.
How Can You Recognize a Bullish Flag Pattern?
Answer :
- To identify a Bullish Flag Pattern, watch for strong upward price movement followed by consolidation between two parallel downward-sloping lines.
- Confirmation of this pattern occurs with an unexpected breakout above its upper trendline with increased volume.
Why Is the Bullish Flag Pattern Significant in Trading?
Answer :
- The Bullish Flag Pattern is significant because it signals the continuation of an uptrend, providing traders and analysts with a reliable means of anticipating bullish movements and making informed trading decisions.
Can the Bullish Flag Pattern be applied across different markets?
Answer :
- Yes, while its basic principles remain constant, this pattern can be utilized across various financial instruments including stock trading, forex trading and cryptocurrency trading.
- To effectively utilize this pattern on each market segment traders must understand its specifics.
What are some risk management techniques when trading the Bullish Flag Pattern?
Answer :
- Effective risk management techniques include setting stop-loss orders to mitigate potential losses, sizing positions according to risk levels and closely watching trades for signs of market reversals.
- Traders must also keep in mind overall market conditions and external influences that might impede pattern reliability.
What Is a Bullish Flag Pattern Breakout?
Answer :
- A Bullish Flag Pattern Breakout occurs when price action decisively advances beyond the upper trendline of a flag formation, signalling an upward continuation.
- Usually accompanied by an increase in volume, it serves as an entry signal that provides traders and investors an opportune moment to capitalize on what may become an anticipated continuation of bullish trends.
- Accurately identifying this point requires knowledge of market dynamics as well as being able to interpret volume changes alongside price movements accurately.
How Can You Set an Entry Signal In Bullish Flag Patterns?
Answer :
- Setting Target Prices in the Bullish Flag Pattern? When trading the Bullish Flag Patterns, setting target prices is essential to meeting your profit goals and managing risk.
- One way of establishing the target price is to measure the length of a flagpole that sharp upward move just prior to flag formation before projecting it backwards from where the breakout occurred to determine an approximate price target price.


