Introduction : Best Candlestick Patterns
Top best Candlestick patterns have long been a cornerstone of technical analysis, reflecting market sentiment and offering guidance towards both potential profits and losses.
Both newcomers to trading as well as experienced traders alike find being able to decipher these patterns an invaluable skill, this guide illuminates their complexity and utility within modern trading.
Before diving deeper into candlestick patterns, it’s essential to understand their historical importance.
First introduced in 18th-century Japan by rice merchant Homma Munehisa as a way to understand and predict price movements of rice contracts, the candlestick charting technique has since become part of technical analysis worldwide and used by traders worldwide as part of technical analysis.
Best Candlestick patterns provide traders with a visual and psychological insight into market dynamics that traditional bar or line charts don’t.
Top Best Candlestick patterns can serve to signal trend continuation or reversals and assist in identifying entry and exit points in the market they showcase how deeply connected financial markets are with human emotions and psychology.
Understand the Basics :
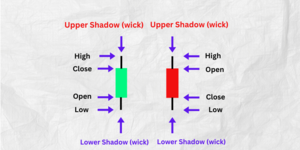
Candlesticks are visual representations of price movements over a given time period.
Their design consists of a “body,” along with “wicks,” or shadows extending above and below its body, high and low prices of each period are marked by shadow’s highest and lowest points, respectively, opening and closing prices are represented by body with color indicative of movement direction.
Bullish (upward) candles indicate that the closing price was higher than its opening price, while bearish (downward) ones do the reverse.
These basic components form the core of all candlestick patterns and help assess market sentiment and potential price action.
Common Candlestick Patterns :
Doji :
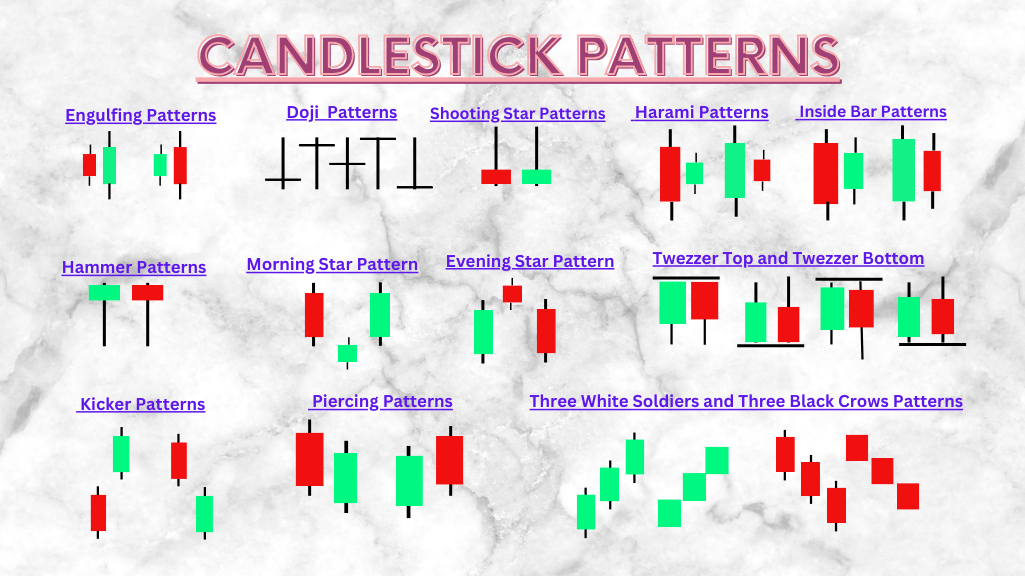
A Doji occurs when an asset’s open and close are nearly equal, with various lengths for both upper and lower shadows that represent market indecision. Traders recognize this pattern as a possible reversal signal when it forms near support/resistance levels.
Hammer :
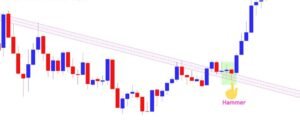
Hammer and Hanging Man both patterns are single candlestick patterns that often form at the bottom of an downtrend.
A hammer has a small body with an extended lower wick (shadow) that measures at least twice its own body.
A hanging man has similar characteristics but forms at the end of an uptrend, suggesting a potential change in direction.
Engulfing Patterns :
Bullish and bearish engulfing patterns are two-candlestick reversal patterns.
Bullish engulfing occurs when a small bearish candle is followed by a larger bullish candle that completely engulfs its predecessor, similarly, bearish patterns signaling potential reversals are formed when small bearish candles are followed by an outsized bullish candle that completely eclipses previous day’s candle.
Morning and Evening Star :
Morning and Evening Star These three candlestick reversal patterns consist of three candlesticks.
A morning star occurs during a downtrend when two large bearish candles are followed by one small-bodied candle (usually doji) followed by one larger bullish candle, its counterpart, an evening star forms during an uptrend at its peak and functions inversely from its counterpart.
Piercing Line and Dark Cloud Cover :
A piercing line is a bullish two-candlestick reversal pattern, often found after significant downtrends.
It consists of a long bearish candle followed by one that closes above midpoint on day 1.
Conversely, dark cloud cover offers its bearish counterpart.
Three White Soldiers and Three Black Crows :
This pattern comprises three bullish (white soldiers) or bearish (black crows) candles to signify a significant shift in market sentiment, signifying either bullish reversal (three white soldiers) or bearish trend reversal.
Three white soldiers indicate an uptrend; while three black crows indicate downward momentum.
Tweezer Tops and Bottoms :
Tweezer tops and bottoms are dual candlestick patterns comprising identical high or low levels, serving to identify areas of support or resistance and possible market turning points.
Advanced best Candlestick Patterns :
While basic best candlestick patterns offer insights into market movements, more intricate candlestick formations such as Harami, Inside Bar and Kicker offer even deeper understandings.
Harami :
The Harami pattern consists of two candlesticks, the first has a wide range, followed by a smaller opposite colored candlestick that either reverses or continues the larger trend. It indicates a potential shift either direction.
Inside Bar :
An Inside Bar | Pattern Spotter An inside bar pattern occurs when both of the current candle’s high and low prices fall within those of its preceding candle’s high and low prices, signifying consolidation with potential breakout depending on context.
Kicker :
A “kiker pattern” refers to two consecutive trend reversal signals that act together, often signalling a dramatic change in market sentiment and trend. The first candle closes in line with its current direction while its counterpart opens opposite to it, closing beyond it and beyond the first candle’s limits.
Practical Application in Trading :
Now that we’ve established the basic understanding of candlestick patterns, it is imperative to discuss their practical application within trading strategies. No matter if it is for long-term investment or day trading strategies candlestick patterns will play a pivotal role.
Day Trading :
Candlestick patterns offer traders a convenient means of making short-term decisions quickly.
Doji, Hammer and Engulfing patterns can be especially powerful, when seen at the beginning of each trading day they could prompt day traders to enter long positions with expectations of a bullish move.
For instance, morning star formation at dawn may indicate this to day traders.
Investing :
Long-term investors can use candlestick patterns to more accurately time their entries and exits.
Candlestick patterns that signal trend reversals such as the three white soldiers may indicate the beginning of an uptrend and could become invaluable tools in their investment toolbox.
Case Studies and Examples :
To illustrate the relevance of candlestick patterns, we’ll review case studies that illustrate their effect on actual market movements.
We will examine specific stocks or assets where candlestick patterns could have been leveraged effectively by traders or investors for successful outcomes.
Importance of Recognizing Candlestick Patterns :
Candlestick patterns’ true power lies not in their mere existence but in recognizing and understanding of market psychology. Each pattern illustrates human emotion while helping anticipate price movements and market sentiment.
Psychological Aspect :
Candlestick patterns reflect the collective psychological state of market participants. From fear and greed to uncertainty and trust, each pattern conveys unique sentiments that direct market movement.
Forecasting Market Sentiment and Future Price Movements :
By understanding and applying candlestick patterns, traders can often predict the strength and longevity of emerging trends.
Recognizing their pattern can allow traders to anticipate market sentiment as well as future price movements, whether reversals or continuations, understanding what the psychological state might portend can be invaluable for traders or investors.
It is therefore essential that traders continue expanding their knowledge of candlesticks patterns so that they may become more profitable traders or investors.
By expanding and applying your knowledge over time, candlestick patterns provide invaluable insights into market movements allowing decision-making powering them ahead of the game while potentially increasing profitability in financial markets.
Tools and Resources for Traders :
Recognizing candlestick patterns doesn’t need to be an onerous task, as there are various resources and tools available that can assist traders in understanding these complex structures.
Platforms and Software :
Many trading platforms and software offer candlestick pattern recognition tools, from simple pattern scanners to complex algorithms that automatically identify and highlight patterns on charts.
Staying Up-To-Date :
Financial markets are constantly shifting, which requires traders to remain knowledgeable of new patterns and market trends in order to continue developing their skills.
Staying informed through subscriptions to trading journals, webinars or financial communities is an integral component of continuing learning and developing your expertise.
Conclusion :
best Candlestick patterns form the cornerstone of technical analysis, providing traders with insight into potential profits and market understanding.
By mastering these patterns, traders can harness market psychology to make sound financial decisions aligned with their goals.
Frequently Asked Questions :
What Are Candlestick Patterns in Trading?
Answer :
Candlestick patterns are visual representations of price movement within financial markets using candles that represent opening, closing, high, and low prices within a certain time period.
How are candlestick patterns useful for day trading?
Answer :
Day traders employ best candlestick patterns such as the doji, hammer and engulfing in day trading in order to identify potential price movements and make fast trading decisions with patterns like these based on them.
Are Candlestick Patterns Reliable for Long-term Investing?
Answer :
Candlestick patterns provide reliable entry and exit signals for long-term investors, particularly ones which signal trend reversals such as the three white soldiers pattern.
What are the Psychological Significance of best Candlestick Patterns?
Answer :
Candlestick patterns serve to reflect market participants’ collective psychology and sentiments such as fear, greed, uncertainty and confidence thus impacting market direction.
Can candlestick patterns predict future market movements?
Answer :
While best candlestick patterns do not serve as definitive prediction tools, they can provide insight into potential market sentiment and the strength or sustainability of emerging trends when combined with other analyses.
What is the Difference between Bullish and Bearish top best Candlestick Patterns?
Answer :
Bullish candlestick patterns such as the three white soldiers indicate potential upward market movements while bearish patterns such as three black crows may signal downward trends.
What is the importance of recognizing advanced candlestick patterns such as Harami or Inside Bar?
Answer :
Recognizing these advanced patterns can provide valuable insights into market movements and improve trading strategies.
Are there tools that help in recognizing best candlestick patterns?
Answer :
Numerous trading platforms and software offer tools for best candlestick pattern recognition, from simple scanners to complex algorithms.
Is it necessary to continuously develop your knowledge about best candlestick patterns and market trends?
Answer :
Staying current with market trends and patterns is critical for developing effective trading skills and remaining competitive in today’s dynamic financial markets.
Can simply recognizing best candlestick patterns lead to successful trading results alone?
Answer :
Best Candlestick patterns provide valuable insights, but for successful trading outcomes they must also be combined with technical analysis, fundamental analysis, and disciplined risk management strategies.
