Mastering the Technical Analysis – Strategies
“Discover expert strategies and valuable insights for mastering technical analysis, empowering you to navigate the financial markets with confidence and precision. Dive into the world of technical analysis and unlock your full trading potential today.”
Introduction: Learn the Technical analysis
- Welcome to the world of technical analysis, where numbers, charts, and a sprinkle of intuition come together to guide your trading decisions. Whether you’re a newbie trader or a seasoned pro, mastering technical analysis can be your ticket to navigating the financial markets with confidence and maybe even a hint of swagger. So, grab your coffee, put on your thinking cap, and let’s dive into this fascinating realm of numbers and trends!
- Are you ready to dive into the fascinating world of technical analysis? Whether you’re a seasoned trader or just starting out, mastering technical analysis can unlock a whole new level of understanding in the financial markets.
- So, what exactly is technical analysis? Think of it as a toolkit filled with strategies and insights to help you make sense of market movements by analyzing historical price data. But don’t worry, you don’t need a degree in finance to grasp the basics.
- Let’s start with the fundamentals. At its core, technical analysis revolves around the idea that historical price movements can provide valuable clues about future price direction. Instead of focusing on the underlying factors driving an asset’s value, technical analysts primarily study charts and patterns to identify trends and potential trading opportunities.

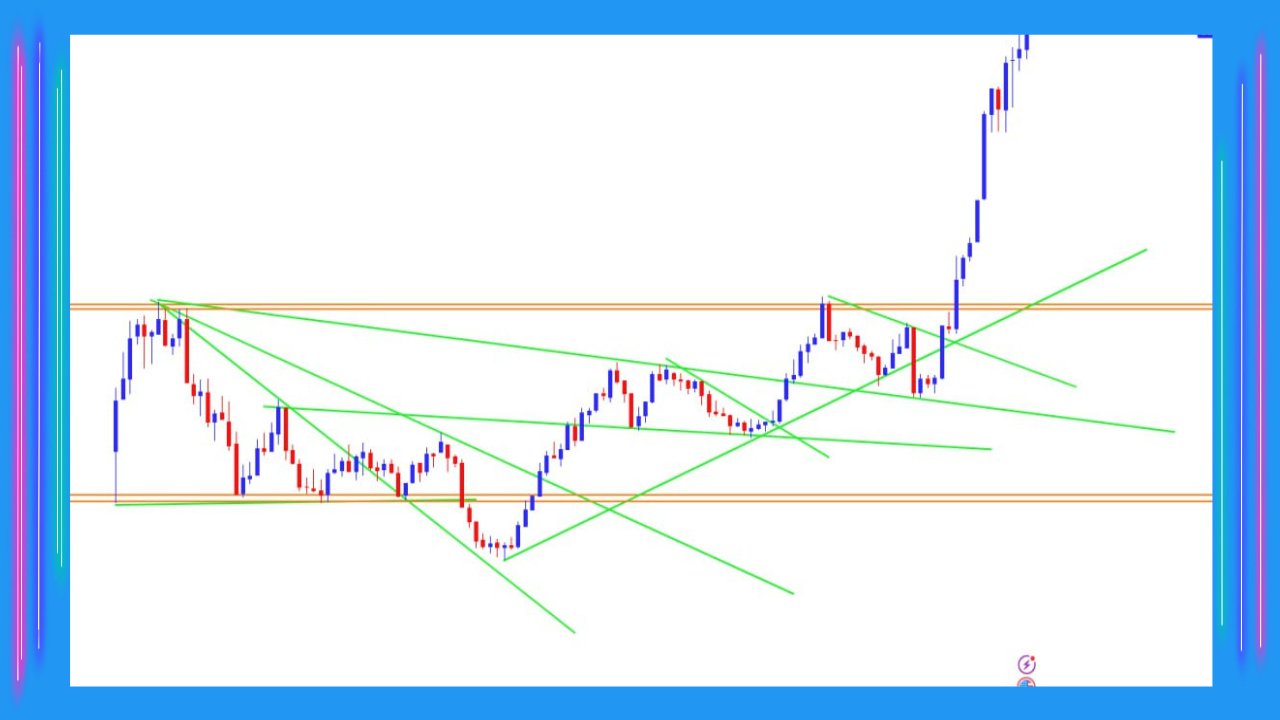
- One of the key concepts in technical analysis is support and resistance levels. Imagine these levels as invisible barriers that the price of an asset tends to bounce off. Support represents a price level where buying interest is strong enough to prevent the price from falling further, while resistance is a level where selling pressure tends to cap upward movement.
- When deciding whether to enter or exit a trade, traders can make more informed decisions if they can recognize these levels.
- Another essential tool in the technical analyst’s arsenal is chart patterns. These visual formations on price charts can provide valuable insights into market sentiment and potential price movements. Common patterns include triangles, flags, and head and shoulders formations, each signaling different phases in market dynamics.
- Indicators are also widely used in technical analysis to help traders gauge the strength and direction of trends. These mathematical calculations applied to price data can generate signals about potential trend reversals, momentum shifts, and overbought or oversold conditions.
- Moving averages (MA), the relative strength index (RSI), and the moving average convergence divergence (MACD) indicator are popular examples of indicators
- Technical analysis is a useful tool for traders, but it is important to keep in mind that it is not perfect.. Market conditions can change rapidly, and no strategy guarantees success every time.
- That’s why risk management is crucial when applying technical analysis techniques. Setting stop-loss orders, managing position sizes, and staying disciplined are essential practices for any trader.

Decoding Technical Analysis: What’s the Buzz About?
- Ever wondered why traders stare at charts like they’re deciphering ancient hieroglyphics? It’s all about technical analysis, the art of predicting market movements based on historical price data. It’s like playing detective with numbers, trying to uncover clues about where the market might be headed next.
The Basics: Understanding Support, Resistance, and Other Fancy Terms
- Support and resistance levels might sound like terms from a superhero movie, but they’re actually the bread and butter of technical analysis. Support is like that friend who always has your back, preventing prices from dropping too low, while resistance is that annoying barrier that stops prices from soaring too high. Mastering these levels is like mastering the art of dodging obstacles in a video game – essential for survival!
Chart Patterns: Finding Shapes in a Sea of Numbers
- Ever looked at a chart and thought it resembled a Rorschach inkblot test? Well, in technical analysis, those patterns actually mean something! From triangles to head and shoulders formations, these shapes tell a story about market sentiment and potential future movements. It’s like finding hidden treasures in a sea of numbers – once you crack the code, you’ll feel like a modern-day Sherlock Holmes!

Indicators: Your Trading Sidekicks
- Imagine having a crystal ball that could predict market trends – well, that’s kind of what technical indicators are like! From moving averages to RSI and MACD, these nifty tools help traders gauge the strength and direction of trends. They’re like your trusty sidekicks, whispering secrets about the market’s next move – just don’t forget to thank them when you strike gold!
Risk Management :
Because Nobody Likes Losing Money
- Risk management – the unsung hero of trading. Similar to using a seatbelt when driving, you hope you never need it but are relieved that it is available just in case.
- Setting stop-loss orders, managing position sizes, and staying disciplined are like the holy trinity of risk management – they might not be glamorous, but they’ll save your bacon when things get hairy.
Conclusion:
- In conclusion, mastering technical analysis is a journey that requires patience, practice, and a willingness to learn. By understanding the basics of chart analysis, support and resistance levels, chart patterns, and indicators, you can gain valuable insights into market dynamics and improve your trading decisions.
- So, whether you’re a beginner or an experienced trader, incorporating technical analysis into your toolkit can help you navigate the complexities of the financial markets with confidence.
- Congratulations, you’ve just scratched the surface of mastering technical analysis! Whether you’re a numbers whiz or still getting the hang of it, remember that trading is as much art as it is science.
- So, keep honing your skills, stay curious, and don’t forget to laugh – after all, even the best traders could use a little humor to lighten the mood when the market gets moody!

Frequently Asked Questions :
What is technical analysis (TA)?
Answer:
- Technical analysis is a method used by traders and investors to analyze financial markets by studying historical price data and identifying patterns, trends, and indicators to predict future price movements.
How does technical analysis differ from fundamental analysis?
Answer:
- While technical analysis focuses on price movements and market data, fundamental analysis involves examining a company’s financial health, management, and industry conditions to determine its intrinsic value.
What are support and resistance levels in T A?
Answer:
- Support and resistance levels are price levels on a chart where buying or selling pressure is expected to cause a pause or reversal in the current trend.
- Support acts as a floor for prices, while resistance acts as a ceiling.
What role do chart patterns play in T A?
Answer:
- Chart patterns are visual formations on price charts that indicate potential future price movements.
- Common patterns include triangles, head and shoulders, and flags, each providing insights into market sentiment and potential trend reversals.
What are technical indicators, and how are they used?
Answer:
- Technical indicators are mathematical calculations applied to price data to help traders analyze market trends, momentum, and volatility.
- Examples include moving averages, relative strength index (RSI), and MACD (Moving Average Convergence Divergence).
How can traders identify trade setups using T A?
Answer:
- Traders can identify trade setups by combining multiple technical signals, such as trend confirmation, support and resistance levels, and indicator crossovers, to determine entry and exit points for trades.
Why is risk management important in T A?
Answer:
- Risk management is crucial in technical analysis to protect capital and minimize losses.
- Strategies such as setting stop-loss orders, managing position sizes, and diversifying portfolios help traders control risk exposure.
What are some common mistakes to avoid when using T A?
Answer:
- Common mistakes include over-reliance on technical indicators, ignoring fundamental factors, and lack of discipline in executing trades.
- It’s essential for traders to balance technical analysis with a broader market perspective and maintain emotional control.
How can traders develop a successful trading plan using T A?
Answer:
- Traders can develop a successful trading plan by defining clear goals, risk tolerance, and entry and exit criteria based on technical analysis.
- Regularly reviewing and adjusting the plan helps adapt to changing market conditions.
What is the importance of continuous learning in mastering T A?
Answer:
- Continuous learning is essential in mastering technical analysis as markets evolve over time.
- Staying updated with new strategies, tools, and market developments ensures traders remain competitive and adaptable in dynamic trading environments.


