Learn Shooting Star and Inverted Hammer Candlestick Patterns :
Shooting Star and Inverted Hammer Candlestick patterns can be considered an integral component of stock trading for experienced stock traders, yet for novice investors they often appear enigmatic with their various shapes and names.
- Candlestick formations rooted in psychological principles provide investors with invaluable insights.
- Of the vast selection of candlestick patterns available to investors, two stand out in particular as offering noteworthy insights the Shooting Star and Inverted Hammer.
- These are two examples that stand out for their distinct natures and can provide useful guidance through volatile markets the Shooting Star and Inverted Hammer can serve as investors’ “Star of Bethlehem”, helping navigate them safely through market uncertainty.
Understanding Candlestick Patterns : Shooting Star and Inverted Hammer
Before we can untangle the Shooting Star and Inverted Hammer mysteries, an introduction into candlestick patterns is required.
- Candlestick patterns offer visual cues for predicting market trend reversals or continuations based on opening, close, high, low prices over a certain time period; and their body denotes open and close prices respectively.
- A bullish candlestick (often white or green in color) indicates that close was higher than open while bearish candles (usually black or red in hue) indicates lower close.
- These Shooting Star and Inverted Hammer patterns originated in feudal Japan’s rice markets and their forms have since permeated time, geography and technological innovation continuing to hold their place despite ever increasing market activity.
- Yet today they still resonate due to their precision and analytical simplicity in today’s busy markets.
The Shooting Star Candlestick :
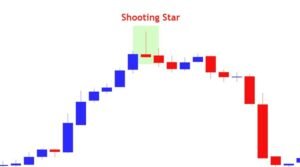
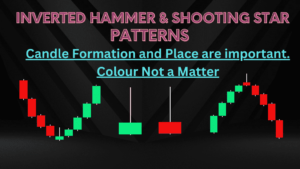
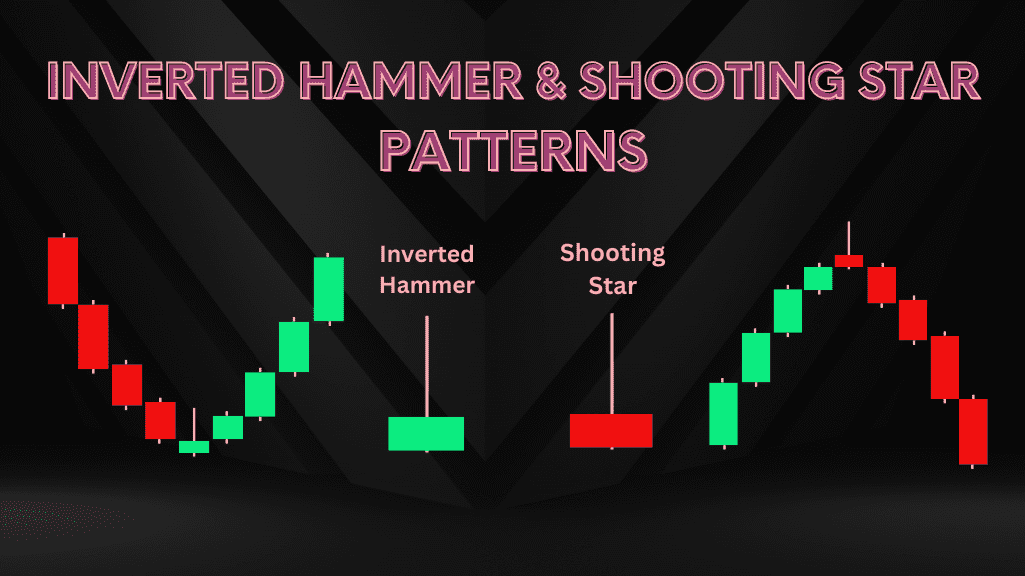
- A Shooting Star candlestick appears at the peak of an upward or downward trend and can easily be identified by its small real body at the lower end of its candlestick, and long upper wick at least two times longer than its real body.
- This unique shape indicates that even though stock prices initially rose significantly during trading hours, sellers ultimately gained control before closing and drove it back down after closing, often signalling that its rally during trading days failed and acting as potential bearish signals.

How Can I Recognize a Shooting Star Pattern :
- A shooting star pattern appears when a stock opens at an elevated price, surges rapidly during intraday trading and then closes near its opening price at the end of its trading session.
- This suggests an inability of its price to maintain altitude, suggesting a potential bearish reversal in price action.
Role of Volume :
- Volume’s Importance A critical factor of a Shooting Star formation is the volume underlying it.
- High volume on its formation day can add credence to its reversal signal, while its daily formation may indicate strong market interest in changing direction.
Illustration Through Historical Crises :
- The Shooting Star’s efficacy can be best shown through historical crises.
- An illuminating example would be its appearance before major market crashes such as the dot com bubble bursting in early 2000s, market participants witnessed its presence along with euphoric highs that preceded classic Shooting Star formation an early warning signaling of impending doom and disaster.
Understanding the Inverted Hammer :
- Similar in appearance to its Shooting Star counterpart, the Inverted Hammer occurs at the lowest point of either an upward or downward trend.
- It features a small real body at the top of a candlestick and long lower wick that may extend twice the length of its body, this shape signifies sessions where prices open significantly lower but recover to close near high of day, often signalling potential bullish reversals.
Locating an Inverted Hammer in Context :
- An Inverted Hammer pattern indicates a loss for bears in their battle for dominance over bulls, giving way to bulls’ ability to control terms and take back lost territory from them, thus serving as an important indicator of potential trend reversal.
Volume as a Validator :
- Similar to the Shooting Star pattern, Inverted Hammer charts gain strength when combined with large volumes. A greater volume can underscore buying activity that occurred throughout the day and strengthen its potential as a bullish reversal indicator.
Historical Cases Demonstrating the Inverted Hammer’s Effectiveness :
- Most notable is its appearance prior to the 2008 and 2020 Financial Crisis, serving as an early indicator for impending market turmoil by signaling bears were unable to maintain control.
- A subsequent rally sent a clear message about potential shifts in sentiment within markets.

Assimilate these patterns for maximum impact :
- It is crucial to recognize that both patterns require markets to be in an uptrend in order for the Shooting Star and Inverted Hammer patterns to emerge, while respectively for them it signifies potential reversals from downtrends.
- When used together they become increasingly meaningful when shown after consecutive up days such as after several bullish runs signalling investor fatigue within bull markets or after consecutive down periods indicating bear fatigue respectively.
- Reliability can vary among these patterns, with the Shooting Star often providing stronger and more reliable signals of potential trend reversals than its Inverted Hammer counterpart, which could be explained by psychology, for example, tops tend to provide bears more opportunity than bottoms for taking over a market.
Trading With the Stars :
- A trader’s analysis is never complete with just the identification of patterns, rather they are used as building blocks of an entire market system.
- Application should always take account of multiple factors, market conditions, trend strength, volume fluctuations and support or resistance levels these all help contextualize these signals in their context.
Steps for Effective Candlestick Pattern Analysis :
- For beginners, it is advisable to practice observing candlestick patterns in various market environments and under various conditions in order to develop an understanding of when each pattern may follow through or when it may just be noise in the market.
- By doing so, practitioners can improve their judgement of when an indication might actually manifest into actionable trading opportunities or when its signals may just be noise in the marketplace.
Regular Practice and Simulation :
- Simulated trading environments offer excellent platforms for these Shooting Star and Inverted Hammer candlestick reading exercises.
- By keeping track of their perceptions and reviewing past results, traders can align their strategy with patterns’ interpretation, evaluating what worked vs what did not.
Expert Perspectives and Continuous Learning :
- Seasoned traders emphasize the value of mentorship for newer traders. Receiving guidance from experienced traders can offer invaluable guidance as to how best incorporate patterns within a wider trading strategy.
Conclusion :
Understanding and employing Shooting Star and Inverted Hammer patterns can have an immense influence on a trader’s career. They represent the essence of market psychology at any given time and offer traders invaluable insights.
- While no signal can guarantee 100% accuracy, properly reading and understanding these patterns offers significant advantages for any trader.
- Shooting Star and Inverted Hammer Candlestick patterns differ from random market predictions in that they reflect traders’ actions and reactions in real time, reflecting emotions driving market movements.
- Just one appearance of one of these patterns at an important moment could unlock significant profits for those willing to put in the time and discipline in understanding them, their rewards could rival even those seen from outer space.
- Mastery of these Shooting Star and Inverted Hammer patterns requires consistent effort, analysis, and learning over time.
- Traders should not only appreciate what insights these patterns provide but also incorporate them into their individual trading strategies patterns such as Shooting Star and Inverted Hammer can give an edge in an otherwise chaotic and unpredictable market environment.

Frequently Asked Questions :
What are Candlestick Patterns Used for in Trading?
Answer :
- Candlestick patterns are visual tools used in trading that depict price movements of securities, commodities or currencies over a specified time frame. Candlestick patterns can serve as useful indicators of market trends as well as trader sentiment.
Are There Different Candlestick Patterns?
Answer :
- There are numerous candlestick patterns, but they are generally divided into bullish, bearish and continuation patterns.
What Is The Significance Of Shooting Star And Inverted Hammer Patterns?
Answer :
- Both Shooting Star and Inverted Hammer patterns serve as indicators of potential reversals: the Shooting Star may portend bearish reversal at the end of an uptrend while Inverted Hammer suggests bullish reversals following downtrends.
Why is Volume Crucial When Interpreting Candlestick Patterns?
Answer :
- Volume is crucial when interpreting candlestick patterns as it provides insight into the strength of buying or selling pressure and adds credibility to any potential reversals indicated by such patterns.
Can candlestick patterns predict market movements?
Answer :
- Candlestick patterns provide indications of potential market movements; however, they should be combined with other technical analysis tools in order to make more reliable trading decisions.
Are Candlestick Patterns Reliable?
Answer :
- The accuracy of candlestick patterns varies based on market context, volume and confirmation from other technical indicators. No pattern should be treated as infallible and traders should use them only as part of an overall analysis strategy.
What is the most effective way to learn candlestick pattern trading?
Answer :
- Both practice and experience are essential. New traders should study various patterns, their theoretical implications, and then put this knowledge into action through paper trading or virtual trading environments before risking real capital.
Are candlestick patterns applicable in all markets?
Answer :
- Yes, you can use candlestick patterns in a variety of markets, including stocks, forex, commodities, and cryptocurrencies.
How do candlestick patterns reflect psychological factors in trading?
Answer :
- Candlestick patterns serve as an accurate representation of market sentiment and trader psychology, representing price movement with bulls vs bears battleground battle.
- Furthermore, candlesticks serve to show shifts in sentiment as potential decision points.
What steps should traders take after identifying a candlestick pattern?
Answer :
- After identifying a candlestick pattern, traders should seek confirmation from other indicators and market conditions before initiating any trades.
- Incorporating factors like overall market trends, volume changes, and anticipated economic events as part of this decision-making process is also vitally important.


