Inverted Hammer Candlestick Pattern in Price Action Chart :
Trading offers many powerful tools and techniques used by both experienced investors as well as newcomers alike. Candlestick charting stands out as an art that reveals patterns in market movements while reflecting investor sentiment in an actionable manner.
- One such pattern that can reveal potential market movements is Inverted Hammer Candlestick pattern charting, when understood and interpreted properly it provides invaluable insight.
Introduction to Candlestick Patterns :
Before we dive into interpreting an Inverted Hammer Candlestick pattern, it’s vital that we first grasp its foundation, candlestick patterns.
- Popularly associated with Japanese rice trader Homma from the early 18th century, candlestick charting provides visual representations of price movements over a given time frame, each candlestick represents one day’s trading activity through characteristics like body size, upper and lower wicks.
- Candlesticks come in various forms such as hammers, dojis, and engulfs that each have different implications for market direction.
- Candlesticks not only record past performance of market trends, but can also serve as forward-looking tools that predict how markets may behave under similar conditions in the future.
Understanding the Inverted Hammer Candlestick Pattern :
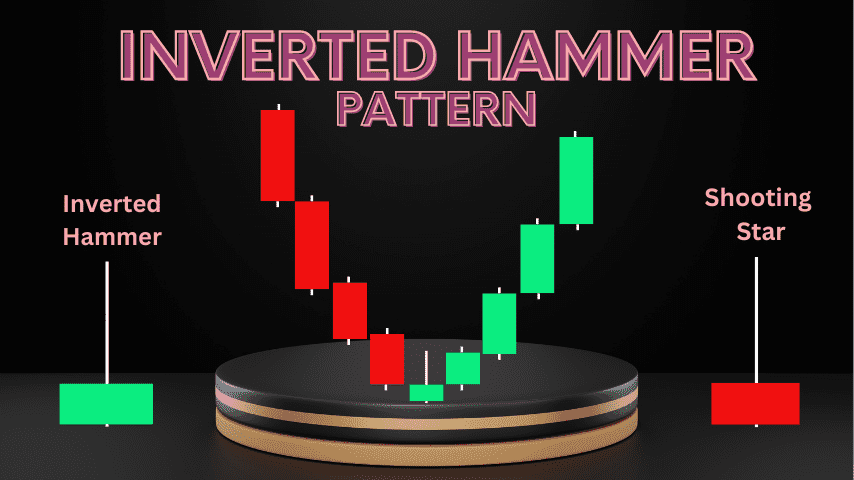
An Inverted Hammer Candlestick pattern typically appears near the end of an downtrend to signal potential upside reversal opportunities.
- An Inverted Hammer is a single candlestick pattern consisting of a small body with a long upper wick that extends two times further than its size of body, any lower wick, if it exists at all, may be either short or nonexistent resembling an upside-down hammer, hence its name.
- An Inverted Hammer Candlestick pattern indicates that sellers were successful in driving down prices during a session, however, by close, buyers managed to wrest control away from sellers and push it back up again, leaving an Inverted Hammer impression in its wake.
- This evidence of changing power dynamics from sellers to buyers is the key message communicated by such patterns.
Finding Inverted Hammers in Stock Charts :
Recognizing an Inverted Hammer in a chart requires more than simply recognizing its shape it requires understanding its context as well. Here is a step-by-step process to assist with that.
- Look for a Downtrend: An inverted Hammer can be especially meaningful when it appears after an extended decline, signalling that momentum could be shifting downward.
- Location of an Inverted Hammer: For maximum effectiveness, an inverted Hammer should appear at the end of any trend, otherwise its significance diminishes rapidly.
- Consider Volume: An increase in volume can give an Inverted Hammer more weight, signalling greater potential for reversal.

Technical Analysis and Inverted Hammer Candlestick pattern:
- Technical analysts view Inverted Hammer Candlestick pattern as an influential signal that should command attention due to its strong indication of a possible trend change.
- While individual candles don’t determine market action directly, they serve as powerful alerts that when confirmed with other factors can become extremely reliable indicators of future market behavior.
Additional Resources for Candlestick Charting :
Are You Exploring Candlestick Charting Further? Here Are Additional Resources that Will Expand and Develop Your Skills.
- Books : There are many books on candlestick charting available, including “Japanese Candlestick Charting Techniques” by Steve Nison and “Candlestick Charting for Dummies“ by Russell Rhoads.
- Online Courses : Udemy and Coursera offer various online candlestick charting courses taught by experts in the field.
- Webinars and Seminars : Many financial institutions and brokerage firms host webinars or seminars focused on technical analysis specifically candlestick charting at various times throughout the year.
- Practice : One of the best ways to sharpen your skills is through practice. Many trading platforms provide virtual environments in which you can practice using candlestick patterns and technical analysis techniques without risking real money.
- Don’t be scared to start honing your abilities today remember, more you learn and practice, the more confident and successful an investor you will become Happy Trading.
Do not stop learning and exploring different candlestick patterns if you wish to advance in trading. Happy investing.
Real-World Examples of an Inverted Hammer’s Effect on Market Trends :
- To understand the real-world ramifications of an Inverted Hammer Candlestick pattern on market events, one need look no further than historical market events.
- During 2008 and 2020 Financial Crisis charts of major indices featured an Inverted Hammer as a prophetic sign of market downturn.
- Similarly during 2017 Bitcoin Price Surge an Inverted Hammer Candlestick pattern formed on cryptocurrency charts heralding the end of bearish trending.
Strategies for Trading or Investing Using an Inverted Hammer :
Recognizing an Inverted Hammer Candlestick pattern is only part of the challenge: traders employ various strategies in order to exploit its implications effectively and make use of this pattern.
- Wait for Confirmation : An inverted Hammer Candlestick pattern doesn’t always indicate an effective trade, so waiting until the next session to confirm its reversal can reduce risk of acting on false signals.
- Establish a Stop-Loss Order : Even though markets can offer great potential profits, their outcomes can still be unpredictable. A stop-loss order provides protection from unanticipated events in the market.
Combine with Indicators: Pairing Inverted Hammer Candlestick pattern trading strategy with other technical indicators may strengthen its foundation further and enable more profitable transactions to take place.

Common Mistakes to Avoid when Working with Inverted Hammer :
Working with candlestick patterns such as the Hammer requires taking a systematic and methodical approach in order to avoid common pitfalls:
- Relying Too Heavily on One Indicator : No single indicator should dictate your trade decisions – look for confirmation from multiple sources before relying solely on one indicator for decision making.
- Ignoring Market Conditions : Each market is distinct, what works in one may not work in another. Consider your broader market context before acting upon candlestick signals.
- Failing to Adapt : Markets evolve over time, so your approach must also adapt. Regularly assess and refine your strategy in response to new trends or disruptions.
Conclusion and Key Takeaways :
The Inverted Hammer Candlestick pattern can be an invaluable asset in any trader’s toolkit, offering timely insights into market reversals when used effectively.
- Remember, its meaning depends on context, so before making significant trading decisions based on an Inverted Hammer Candlestick pattern analysis pattern alone, always verify other aspects of your analysis align with its implications before taking significant actions.
Resources for Further Learning and Practice :
Candlestick analysis offers numerous resources that can help those interested in deepening their understanding. There are online courses offering structured candlestick analysis courses.
- Candlestick Exchange : Online platforms providing structured courses.
- Trading Platforms : Trading platforms offer educational resources and simulated trading environments for novice traders.
- Books and Journals : There is an abundance of literature on candlestick and technical analysis ranging from seminal texts to contemporary journals containing knowledge that you can take advantage of when trading.
Keep in mind, Inverted Hammer and other candlestick patterns aren’t magic wands but tools to aid your decision-making. The Inverted Hammer will reveal itself at just the right moment – pay attention, interpret wisely, and may your trades always prove profitable and enriching.
Conclusion :
- The Inverted Hammer Candlestick pattern stands out in candlestick charting because of its ability to detect potential trend shifts. By being aware of this pattern, traders can gain more insight into market movements and make more informed decisions regarding their investments.
- However, as with any technical analysis tool, it’s essential to remember that the Inverted Hammer should only ever be used as one part of a comprehensive analysis process.
- With practice and experience, investors can leverage candlestick charting including Inverted Hammer Candlestick pattern charts to navigate today’s ever evolving markets more successfully. So continue learning different candlestick patterns for an edge in trading,Happy investing.

Frequently Asked Questions :
What Is an Inverted Hammer in Candlestick Charting?
Answer :
- An Inverted Hammer candlestick pattern occurs at the bottom of a downtrend and may signal a potential change in market direction. It features a small body at the lower end with long upper shadow and short lower shadow typically appearing near the lowest point in an uptrend.
What can I use to identify an Inverted Hammer on a chart?
Answer :
- Identify it by looking for candlesticks with small bodies at the lower end of trading range, long upper shadows that extend at least twice their body’s length, and very short or no lower shadows, these forms often form during downtrends.
Is an Inverted Hammer considered bullish or bearish signal?
Answer :
- An Inverted Hammer Candlestick pattern can be considered a bullish reversal signal. It indicates that, despite selling pressure during trading sessions, buyers were still able to push prices higher, signalling potential shifts in momentum.
How reliable is an inverted Hammer as an indicator for market reversals?
Answer :
- Although an Inverted Hammer may serve as a reliable indicator of market reversals, its accuracy should be confirmed through subsequent trading sessions. Furthermore, using multiple technical analysis tools and indicators increases their reliability even further.
Can the Inverted Hammer Be Utilized on All Market Types?
Answer :
- Yes, the Inverted Hammer Candlestick pattern can be observed and utilized across different types of markets such as stocks, forex, commodities and cryptocurrencies, however context and market conditions must always be taken into consideration to provide accurate interpretation.


