The Downside Tasuki Gap : A Comprehensive Guide for Traders
Introduction:
The Downside Tasuki Gap, an essential candlestick pattern for traders. Unlearn trading strategies, real-life examples, and how to avoid common pitfalls for bearish market navigation with this vital candlestick pattern.
- Within technical analysis, the Tasuki Gap is an influential candlestick pattern that provides valuable insights into market trends and potential trading opportunities.
- Deriving its name from Japanese word for ladder, this candlestick formation consists of a gap in price action that is followed by specific candle formation.
In this blog post we will delve into Downside Tasuki Gap by investigating its meaning, real-life examples, and how traders can leverage this pattern into their trading strategies.
The Downside Tasuki Gap: Formation and Implications
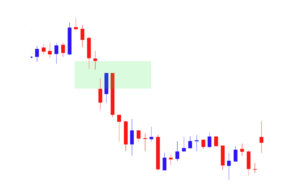
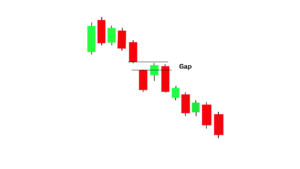
The Downside Tasuki Gap is a prominent chart pattern which appears during bearish market trends and can be identified by three specific candles that indicate further downward momentum. This chart pattern unfolds as follows:
- 1. The first candle reflects negative sentiment in the market.
- 2. The second bearish candle also displays this trend but stands out because of its dramatic opening gap downward compared to previous candles – further reinforcing bearish momentum.
- 3. The third candle in this series is bullish, opening within the body of the second candle but failing to turn around its bearish trend by closing within its gap left by its predecessor without completely filling it, thus failing to overturn bearish sentiment.

- Downside Tasuki Gaps are an early indicator of bearish sentiment in the market and point towards further downward movements.
- When an initial gap down is followed by bulls’ inability to completely close it back out is indicative of bears dominating.
As such, many traders use its appearance as confirmation that sellers have established control and that market may continue its downward movement, making this pattern an important indicator for those hoping to take advantage of bearish trends.
Real life examples of the Downside Tasuki Gap :
To better grasp the Downside Tasuki Gap, let’s look at real examples from different markets:
Apple Inc. Stock (AAPL) :
- On this historical chart of Apple Inc. stock, we can see evidence of the formation of a Downside Tasuki Gap before an significant price decline.
- Traders who recognized this pattern could have entered short positions with stops set above the gap while hoping for significant profits as the downtrend progressed.
EUR/USD Forex Pair :
- This example from the forex market displays a Downside Tasuki Gap during a bearish trend on EUR/USD pair, providing forex traders an opportunity to enter sell positions using stop-losses placed above gap, managing risk by placing stop-loss orders above said gap, and targeting profits according to trend prevailing at that moment.
Bitcoin (BTC) Case Study :
- Even within the unpredictable world of cryptocurrencies, the Downside Tasuki Gap provides valuable insights.
- We see it manifest during a bearish period; crypto traders could have used this signal as an entry signal into short positions for further downside movement.

Trading Strategies for the Downside Tasuki Gap :
Consider these strategies when applying the Downside Tasuki Gap pattern in your trading strategy:
- Entry Point: Take short positions when the pattern has been confirmed with its third candle closing within its gap.
- Stop-Loss Order: Establish a stop-loss order above the gap to manage risk if the trend unexpectedly reverses unexpectedly
- Profit Targets: Ascertain an achievable profit target that aligns with both current trends and other technical analysis factors like support and resistance levels.
- Confirmation: For added confidence in the strength of a Downside Tasuki Gap signal, look for other indicators or patterns such as volume or momentum indicators or chart patterns to support it.
Pitfalls to Avoid With the Downside Tasuki Gap :
The Downside Tasuki Gap can be an extremely valuable indicator for traders, providing potential shifts in market sentiment. But traders must approach it carefully and be aware of its complexities, otherwise you risk falling into its clutches and missing opportunities.
- False Signals: Not every gap down followed by a bullish candle is indicative of an accurate Downside Tasuki Gap pattern, and misinterpretations could result in premature or incorrect trading decisions.
- Over reliance: Although the Downside Tasuki Gap can offer invaluable insights into market movements, it should not serve as the sole foundation of your trading strategy.
Using it alongside other technical analysis tools like trend lines, moving averages and indicators and focusing on fundamental factors that may impact the market is recommended to ensure accurate signals are received and more informed trading decisions made.
- Ignoring Risk Management: One of the cornerstones of successful trading lies in implementing proper risk management strategies, such as setting stop-loss orders to limit losses and managing position sizes accordingly to prevent overexposure to any single trade.
- Failing to properly implement risk management practices could result in serious capital losses should markets move against your position – this makes effective risk management essential in long-term trading success.
As mentioned previously, while the Downside Tasuki Gap can be an attractive signal for traders, it is critical that they approach it with an understanding of its limitations and integrate it into an overall trading plan that emphasizes technical analysis diversity and rigorous risk management.

Conclusion:
- Recognizing and mastering the Downside Tasuki Gap can provide traders with a valuable tool for navigating bearish markets and recognizing short selling opportunities.
- By studying real-life examples, developing sound trading strategies, and avoiding common pitfalls, traders can effectively incorporate this candlestick pattern into their technical analysis toolbox.
Frequently Asked Questions :
What Is A Downside Tasuki Gap?
Answer :
- A Downside Tasuki Gap is a bearish candlestick pattern found during downtrends that features two bearish candles followed by an smaller bullish candle which opens within its body but does not close the gap between them suggesting continuation of this downtrend.
- This suggests continuation of that trend.
What Are Downside Tasuki Gaps?
Answer :
- To spot a Downside Tasuki Gap, look for an upward trend followed by two large bearish candles that form an upward gap and then an additional bullish candle opening within its body but failing to close this space between first and second candles.
Why is the Downside Tasuki Gap such a helpful pattern for traders?
Answer :
- This pattern’s significance lies in signaling an ongoing bearish trend, giving traders greater confidence when entering or maintaining short positions with increased short positions.
- Recognizing this pattern also allows traders to capitalize on further price decreases as prices follow its formation.
Are there any mistakes to watch out for when trading the Downside Tasuki Gap?
Answer :
- Common errors include misidentifying the pattern, not waiting for confirmation of trend continuation, overrelying on patterns without using other analysis tools and not engaging in risk management practices such as setting stop-loss orders.
Can the Downside Tasuki Gap be applied to various markets?
Answer :
- Absolutely. Traders can utilize and identify this pattern across a wide array of assets like stocks, forex and cryptocurrencies though its frequency may differ based on market dynamics and time frames.
- Therefore it is wise for traders to adapt their strategies according to each specific market they trade in.
Web Story :– https://trendfollowingtips.com/web-stories/downside-tasuki-gap-meaning-and-examples/


