The Double Bottom Chart Pattern : A Complete Guide for Traders
Introduction :
- Traders and investors have used the technical analysis technique known as the double bottom chart pattern as it is quite consistent in forecasting market reversals.
Usually indicating the conclusion of a downturn and the start of an upswing, this pattern is an essential indication for trading entry and exit points.
Mastery of the double bottom chart pattern will help you to unlock successful trading.
- Discover its creation, relevance, identification methods, and real-life instances to strengthen your trading plan and raise your market forecasts.
Understanding the Formation and Significance :
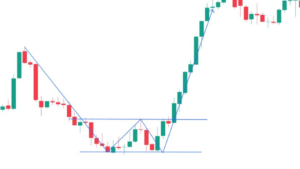
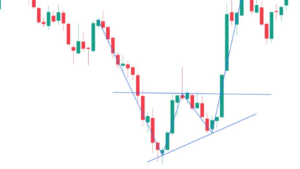
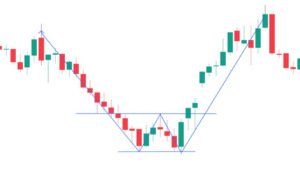
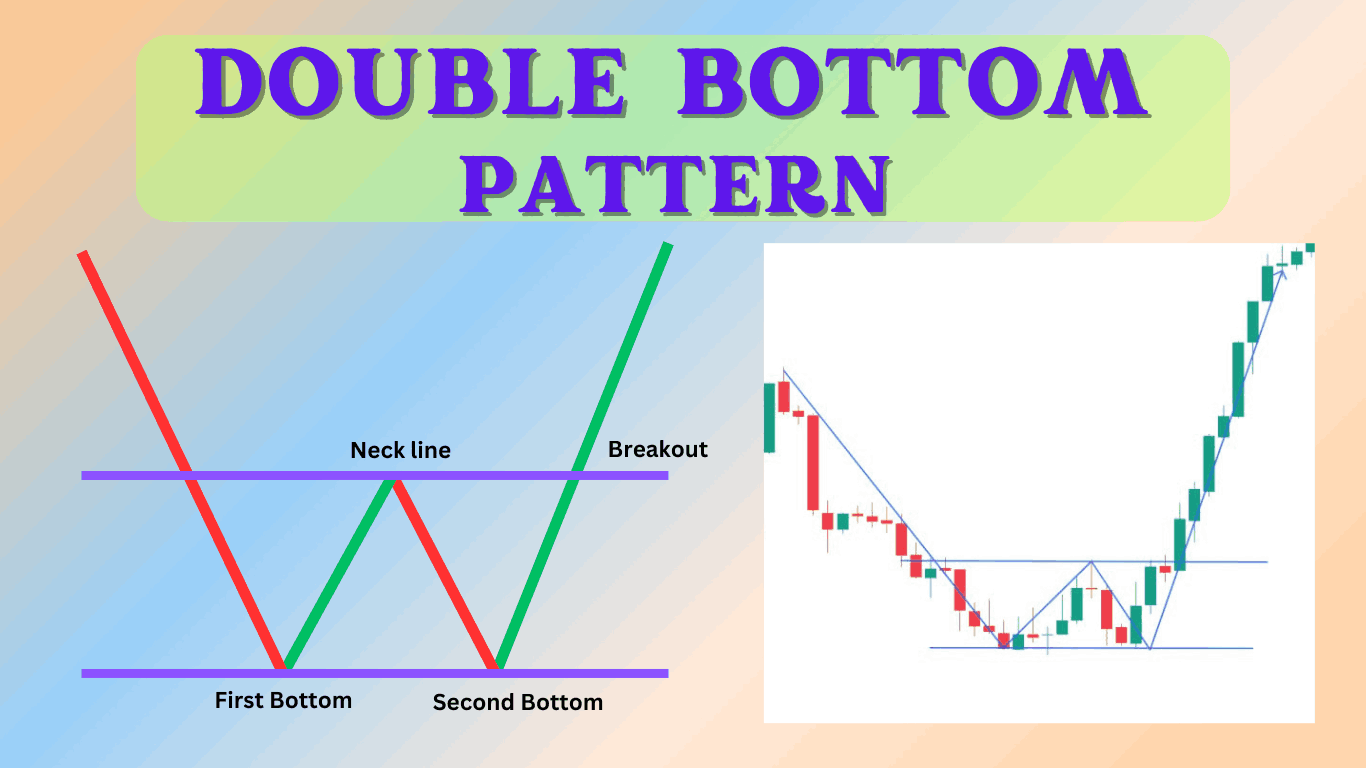
- Once the price of a security reaches a low point (support level), it bounces back to a higher level (resistance level), then falls once again to the same support level in a double bottom chart pattern following a protracted downward trend.
- Once the price passes over the resistance level following the second drop, the pattern is finished.
- This V-shaped structure suggests possible bullish momentum by resembling the letter “W.”

Why should this be significant?
- The Double bottom pattern is noteworthy as it suggests that the market failed to break a twice tested support level.
- Strong buying activity at that level would so imply, and might cause a trend reversal and possible profit possibilities.
How to Identify Double Bottom Chart Patterns on Stock Charts :
On stock charts, identifying a double bottom chart pattern calls for several thorough steps:
Look for a Downtrend :
- Make sure the security has been in a declining trend prior to the pattern developing.
- This is crucial as a double bottom is a reversal pattern and only indicates a reversal if a past downturn is there to reverse.
Identify the first bottom :
- That is the low point where the price rebounds back from a support level.
- Usually following a protracted fall, this initial bottom should be clearly seen in the price action of the stock.
Observe the Rebound :
- After striking the initial bottom, the price should climb to a resistance level but fail to keep rising.
- Usually, buyers arrive believing the stock is under priced but are not yet powerful enough to drive the price over the resistance level.
Spot the Second Bottom :
- The price should once again drop to the same support level as the previous bottom to create the second trough.
- There should be a clear “W” pattern developing in the chart and this second bottom should be somewhat near in price to the previous bottom.
Confirmation :
- The pattern is verified when the price crosses over the resistance level following the second bottom.
- This break above resistance is a strong indication that the stock could be rising rather than that the negative trend has inverted.
- Since it shows higher confidence behind the move, traders frequently search for more volume to go with this breakout.
Following these guidelines carefully helps traders to more precisely spot double bottom formations and make wise judgments regarding possible stock price trend reversals.

Double Bottom Chart Patterns in Different Market Conditions :
Bull Markets :
- Double bottom chart patterns can indicate continuation patterns in bull markets, meaning brief declines prior to the upswing picking back up.
- Usually when investors take gains, these trends show up and cause a minor drop in prices.
- Still, the price usually recovers as market confidence stays strong, therefore verifying the ongoing upward trend.
Bear Markets :
- These trends are more likely in bear markets to show a possible reversal, therefore marking the conclusion of the down trend and the start of a bullish phase.
- This happens when buyers start to join the market expecting a recovery and sales pressure declines.
- A bear market’s double bottom’s emergence might be a really good sign that the worst may be behind us and a fresh upward trend is just around.
Tips for Trading Double Bottom Chart Patterns :
Entry Strategy :
Wait for Confirmation :
- Only trade when the price clearly breaks over the resistance level to guarantee a real breakout rather than a misleading indication.
Employ Limit Orders :
- To grab the breakout, place limited orders somewhat above the resistance level.
- This helps to achieve a better entrance price and raises the possibility of carrying out the deal at the intended level of pricing.

Exit Strategies :
Set Profit Targets :
- Profit targets should be found depending on the height of the pattern added to the breakout point.
- To create reasonable profit goals, this entails figuring the distance from the lowest point to the resistance level and adding it to the breakout point.
Trailing Stops :
- Allow space for more upside while locking in gains.
- Changing the stop-loss order when the price moves in your advantage will help you guard your winnings and provide the trade room to expand.
Risk Management :
Stop-Loss Orders :
- Place stop-loss orders beneath the second bottom to reduce possible losses.
- This guarantees that, should the transaction turn against you, your losses will be limited to a pre-defined extent, therefore safeguarding your capital.
Position Sizing :
- Always utilize suitable position size to properly control danger.
- This ensures that no one trade may have a major influence on your portfolio by computing the maximum amount of cash you are ready to risk on a single trade and modifying the size of your position in line.
Valuation of Double Bottom Chart Pattern Confirming Indicators :

Although the double bottom chart pattern is dependable, confirming signs will improve its precision:
• Volume Analysis :
- Rising volume in the breakout validates the pattern.
• Moving averages :
- Further validation might come from crossovers of moving averages.
• Relative Strength Index (RSI) :
- Confirming bullish momentum, an RSI below 30 at the bottoms will increase subsequently to 50 during the breakthrough.
In summary
Conclusion :
- A great instrument in the trader’s toolkit is the double bottom chart pattern.
- Understanding its development, importance, and identification helps traders to make wise judgments and seize any market reversals. Including this pattern into your trading plan will increase accuracy and profitability.

Frequently Asked Questions :
What is a double bottom chart pattern?
Answer :
- Forming following a downswing, a double bottom chart pattern is a bullish reversal.
- It comprises two successive lows about at the same level, with a high in between that resembles the letter “W.”
- Traders seek for this pattern to indicate the conclusion of a declining trend and the start of an upward one.
How reliable is a double bottom chart pattern for trading?
Answer :
- When figuring market reversals, the double bottom chart pattern is regarded as one of the most consistent chart patterns.
- No pattern, however, is perfect. To raise the pattern’s accuracy, one should use confirming indicators such RSI, moving averages, and trading volume.
Can double bottom chart patterns occur in any market?
Answer :
- Indeed, every financial market—stocks, currency, commodities, even cryptocurrencies—can have double bottom chart patterns.
- The pattern is a flexible tool for technical study as its ideas hold true across several markets.
How long does it take for a double bottom chart pattern to form?
Answer :
- The market and time span under analysis will affect the formation time of a double bottom chart pattern.
- On a daily chart, it may show few weeks to many months; on an intraday chart, it can show minutes to hours.
- Waiting for the pattern to finish calls for great patience.
What are common mistakes traders make when trading double bottoms?
Answer :
- Typical errors include starting a trade before the pattern is verified, neglecting the larger market background, and not applying stop-loss orders as appropriate risk control techniques.
- One should wait for a breakout over the resistance level and use suitable risk control measures.
Are there any variations of the double bottom chart pattern?
Answer :
- Indeed, versions of the double bottom chart pattern comprise the triple bottom and inverse head and shoulders forms.
- Though they include more price volatility before the breakout, both variants show possible positive reversals.
- Knowing these differences helps one to grasp the dynamics of the market.


