Learn Descending Triangle Chart Pattern: Guide for Technical Traders
Introduction to Chart Patterns :
- Technical analysis depends much on chart patterns, which enable traders to easily forecast future price changes.
- Through analysis of past pricing data and identification of particular trends, traders can make informed conclusions about possible market developments.
- Of all the myriad chart patterns available today, one particularly useful descending triangle stands out as an invaluable asset to stock traders, cryptocurrency investors, technical analysts, day traders and forex traders alike.
- The descending triangle chart pattern is a negative technical analysis formation indicating possible market swings down.
- Its multiple lower highs converging with an overhead support line, which often precede significant price breaks and can serve as an effective trading indicator.
- This comprehensive analysis explores the descending triangle chart pattern from its formation, significance and identification through to identification strategies, trading strategies and risk management.
What is the Descending Triangle Chart Pattern ?
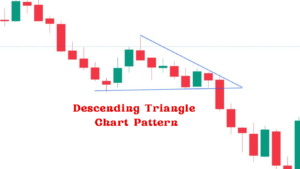
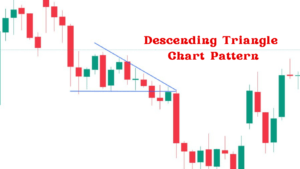
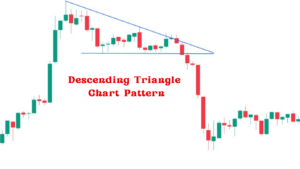
- Usually formed of lower highs and a horizontal support line, a descending triangle chart pattern is a continuation pattern indicating an approaching downward breakthrough.
- As this formation proceeds, price action gets squeezed between its descending trend line and support, creating tighter ranges over time.
- With its visual representation and key components as detailed below, the Descending Triangle Chart Pattern becomes clear.

Lower Highs :
- Each peak in the pattern is lower than its predecessor, signifying weakening bullish momentum.
Horizontal Support Lines :
- Price repeatedly bounces off this strong support level creating a flat bottom for price to touch again and again.
Volume Decrease :
- As the pattern unfolds, trading volume typically decreases over time before experiencing an upsurge upon breakout or breakdown.
How It Forms :
- A descending triangle pattern typically arises when sellers become more aggressive than buyers in driving prices lower while buyers subsequently step in at an established support level to stop further drops in price.
- This dynamic eventually produces what visually resembles a descending triangle, hence its name.
Significance in Trading :
- Recognizing descending triangle patterns is crucial for traders as they often indicate significant price movements and provide strategic guidance across markets such as stocks, cryptocurrency and forex.
- By understanding their implications traders can make strategic decisions in regards to stocks, cryptocurrency and forex trading.
Stock Market :
- Recognizing a descending triangle can help stock traders anticipate potential bearish breakouts, giving them time to position themselves accordingly.
Cryptocurrency :
- When applied to cryptocurrency markets, this pattern provides insight into market sentiment and forthcoming price actions.
Forex :
- Forex traders, the descending triangle pattern can provide useful indicators on currency pair strength as well as potential breakdowns.

How to Identify and Confirm the Pattern :
Step-by-Step Guide
- Find Lower Highs : Search for series of peaks where each subsequent high is lower than its predecessor.
- Draw Horizontal Support Lines : Locate areas where prices have repeatedly rebounded off a level and formed a flat bottom.
- Monitor Volume : Monitor trading volume to ensure it decreases as the pattern unfolds.
- Verify Breakout : Wait until price breaks below horizontal support line with significant volume growth to confirm breakout.
Examples from Real-Time Charts
Example 1 :
- Apple Inc. Stock – Apple Inc. exhibited a descending triangle pattern on its historical chart that eventually led to a breakout and significant price movement.
Example 2 :
- Bitcoin Cryptocurrency – During a recent market cycle, BTC’s chart displayed a descending triangle formation which indicated a bearish breakout and had significant implications for cryptocurrency traders.
Trading Strategies Based on Descending Triangle Chart Pattern :
Breakout Strategy :
- A price breaking below its horizontal support line indicates bearish momentum, providing traders an opportunity to enter short positions to capitalize on it.
- Anticipating a breakdown, traders might place stop orders just below support lines in anticipation of its potential collapse.
- This allows them to enter the market once breakout is confirmed by increased volume which typically indicates stronger and more reliable trend lines.
- By taking this proactive measure, traders aim to minimize risk while capitalizing on market dynamics to take full advantage of potential gains and make optimal use of market dynamics for potential gains.
Setting Targets :
- Targets may be set by measuring the height of a triangle (distance between horizontal support and highest peak) and projecting it downward from its breakout point.

Risk Management and Target Setting :
Managing risk and setting targets requires both planning and measuring performance targets for success.
- Stop-Loss Orders: Set stop-loss orders just above horizontal support lines to limit potential losses.
- Position sizing : Utilizing proper position sizing techniques will ensure that no single trade significantly impacts your trading capital.
- Establish Realistic Targets :
- Price Projection: Measure the height of the triangle and project its lower edge towards its breakout point to set a realistic price projection target.
- Trailing Stops: Implement trailing stops as price moves in your favor to lock in profits as they accumulate.
Conclusion :
- Descending triangle chart patterns can be powerful tools for traders in various markets.
- By understanding their formation, significance, and trading strategies you can sharpen your technical analysis skills while increasing trading outcomes.
- Understanding and mastering the declining triangle chart pattern will help you to be more ready to negotiate the erratic world of trading and make wise judgments leading to success.
- The power of descending triangle chart patterns in trading. Uncover their significance, how to recognize them, confirm them, and effective strategies for stocks, cryptocurrency trading platforms, and forex.

Frequently Asked Questions :
What is Descending Triangle Chart Pattern ?
Answer :
- Definition A descending triangle chart pattern is a negative technical analysis formation indicating possible market swings down.
- Its hallmark is multiple lower highs converging with an overhead support line, which often precede significant price breaks and can serve as an effective trading indicator.
How may I identify a Descending Triangle Chart Pattern?
Answer :
- Look for lower highs on the price chart to identify a declining triangle pattern, each new peak is lower than its predecessor.
- Next, draw a horizontal support line through any points where prices have repeatedly bounced, make sure trading volume decreases over time as part of this pattern to verify its authenticity.
Can one apply the descending triangle pattern on other markets?
Answer :
- Indeed, one may use the declining triangle chart pattern to a spectrum of markets including forex, equities, and cryptocurrencies.
- It lets traders make strategic judgments considering market dynamics and foresee possible negative breakouts.
What strategies work well with the descending triangle chart pattern?
Answer :
- Traders usually utilize breakout and breakdown strategies when trading the descending triangle chart pattern.
- A breakout strategy requires entering short positions when price falls below horizontal support lines, while in a breakdown strategy stop orders may be placed just under these support lines with orders to enter once a breakout has occurred with increased volume.
How can I manage risk when trading with the descending triangle chart pattern?
Answer :
- Effective risk management is of paramount importance when trading the descending triangle pattern.
- Set stop-loss orders just above the horizontal support line to limit potential losses, use position sizing techniques that don’t significantly eat into your trading capital, set realistic targets by measuring the height of the triangle and projecting it downward from its breakout point, implement trailing stops when price moves in your favor, and set trailing stops to secure profits as they increase.


