Profitable Strategies for Traders: The Dark Cloud Cover Pattern
Successful traders understand that understanding and exploiting any signs that indicate potential stock trading trouble could be around the corner, such as ripples in the water that indicate potential storms.
One such harbinger is the Dark Cloud Cover pattern an eye catching formation familiar to candlestick traders that could signal impending doom or profit for them.
By understanding and taking advantage of its power, knowing this formation could make all the difference between safely sailing into profit or being trapped in turbulent waters of loss.
The Dark Cloud Cover pattern in candlestick charting to gain a full grasp of its intricacies. Learn how this bearish reversal indicator can signal a shift from bullish to bearish market conditions, providing traders with ample opportunity to exit or short-sell ahead of any potential market downturns.
What exactly is the Dark Cloud Cover Pattern and how can traders use its potential?
Continue reading as we unpack this formidable candlestick structure, highlight real-world examples, and offer strategies for optimizing trades using this indicator.
Introduction to the Dark Cloud Cover Pattern :
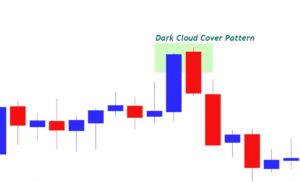
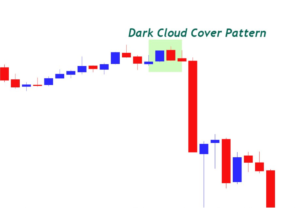
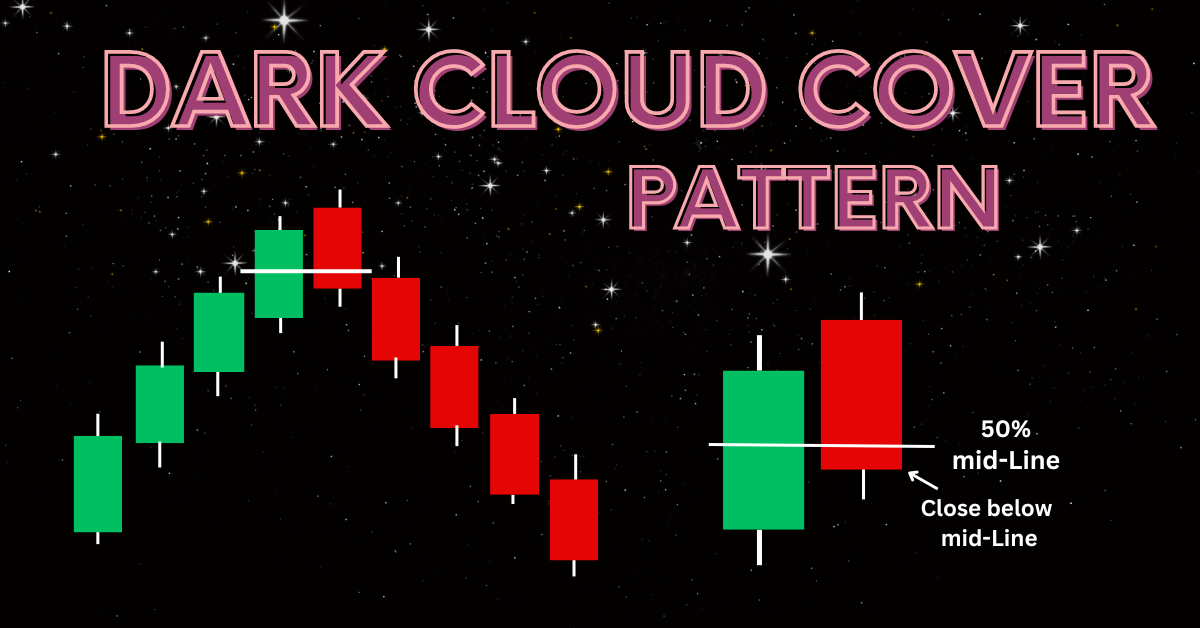
Dark Cloud Cover, a bearish reversal pattern found at the end of an uptrend, consists of two candles.
- The first candle, which is large bullish candle.
- The second candle opens higher than its counterpart but closes below its midpoint body.
This pattern indicates a potential change from an uptrend to a downtrend, when taken in conjunction with other technical indicators and price action.
When observed within context of other technical indicators and price action, this pattern can provide invaluable insights into market sentiment as well as any potential shifts in direction of stocks.

Understanding the Structure of Dark Cloud Cover :
Candlestick patterns provide visual representations of market sentiment and are integral parts of technical analysis. Gaining an understanding of their anatomy is vital in deciphering their messages.
Breakdown of Candlestick Patterns :
Candlesticks are created from the opening, high, low, and close prices over any given trading period.
Their structure resembles that of an umbrella in that its “wick” or “shadow” represents high and low prices while the “body” shows opening and closing prices; bullish candlesticks usually appear white or green in colour while bearish ones typically become darker over time (black or red in hue).
Interpretation and Analysis :
The Dark Cloud Cover pattern is easy to spot and understand, as it occurs when bullish sentiment is suddenly overtaken by bearish sentiment, prompting an immediate decline.
A close below midpoint indicates how strong bears have become and signalling potential change in trend direction.
Real-World Examples of Dark Cloud Cover in Trading :
Nothing beats seeing something first-hand to prove something theoretical. We look back on historical cases in which Dark Cloud Cover provided insight into significant stock movements.
- Tech Bubble Burst (2000): To understand this phenomenon, the Dark Cloud Cover pattern was prominent among tech stocks prior to their bursting. Amazon provides an illuminating case study.
- Lehman Brothers in the 2008 Financial Crisis: Lehman Brothers was hit with an early warning sign of this crisis when their Dark Cloud Cover pattern appeared, serving as an early indicator.
- Volatility (2013-2014) of Tesla Stock: At times of high volatility, Tesla stock’s Dark Cloud Cover pattern provided opportunities for short-term gains that offered day traders short-term opportunities.
- COVID-19 Pandemic (2020): Multiple sectors experienced uncertainty and subsequent decline, with airline industry providing an excellent example.
Lessons Learnt and Patterns to Watch :
- The Dark Cloud Cover pattern does not guarantee a trend reversal, but should still be monitored closely to identify possible shifts in market sentiment.
- To determine its significance properly, one should take into account volume, strength of trend and other patterns simultaneously to validate this indicator.
- Keep an eye on market trends as this could have an impactful on the reliability of Dark Cloud Cover’s signals.
Strategies for Trading with the Dark Cloud Cover Pattern :
There’s no one-size-fits-all approach when it comes to using the Dark Cloud Cover pattern as a trading indicator, so here are a few strategies you may wish to keep in mind when including it into your trades:
- Combining with Other Indicators: For maximum reliability, combine Dark Cloud Cover with other technical indicators, such as trend lines or moving averages.
- Adopt Risk Management Techniques: As with all trading strategies, using risk management tools like stop losses and position sizing can help limit potential losses.
- Consider Time frame: Depending on your trading style and goals, Dark Cloud Cover can be used both short-term and long-term trades. Understanding both goals and time frame can maximize its use effectively.
- Monitor Market News and Events: Keep abreast of market events which could influence stock movement as this could compromise the reliability of the Dark Cloud Cover pattern.
Strategy for Trading the Dark Cloud Cover Pattern :
Success when trading the Dark Cloud Cover requires taking an integrated approach that considers entry and exit points, risk management strategies and more.
Exit Points :
- Enter short positions after the completion of a Dark Cloud Cover pattern, typically below the low of the second candle.
Utilize additional indicators like moving averages or the Relative Strength Index (RSI), to further support your entry point.
Risk management practices :
- Set stop-loss orders above recent highs to protect against sudden reversals.
- Calculate position sizes according to your risk profile and capital to prevent significant losses.
Common Mistakes to Avoid When Using Dark Cloud Cover :
As traders use the Dark Cloud Cover pattern as their main indicator, there may be potential traps when over relying solely on it as an indicator.
Single Pattern :
- Never over reliance on one single pattern to confirm signals and limit false entries.
- When trading Dark Cloud Cover signals, make sure they fit within their larger context by considering market trends and economic indicators as part of your overall trading decisions.
Ignoring Market Context :
Be wary of trading decisions made solely based on Dark Cloud Cover signals without taking into account other economic data points to make sure this indicator aligns with wider market structures.
Assess Impact of Dark Cloud Cover on Market Sentiment :
Understanding how Dark Cloud Cover affects market psychology is integral for making informed trading decisions.
Influence on Trading Psychology :
- The Dark Cloud Cover pattern may cause panic among bullish investors, leading them to liquidate long positions and potentially spark an avalanche of sell-off effects.
- Traders’ response can become self-fulfilling prophecies.
Long-Term Implications on Investment Decisions :
- Monitoring Dark Cloud Cover patterns over time can influence traders or investors in terms of stock selection and trade timing decisions.
- Acknowledging its implications could have significant long-term implications on portfolios.
Conclusion :
The Dark Cloud Cover pattern is an indispensable strategy for traders.
By mastering its subtleties, understanding its impact on market psychology, and using it wisely alongside other indicators, traders can enhance their decision-making ability and take advantage of profitable opportunities.
To take full advantage of the Dark Cloud Cover pattern’s potential, it is necessary to examine, develop and refine your trading strategies.
There’s no guarantee for success; rather it serves as an initial step toward developing more informed and precise trading approaches.
Build your knowledge on this and other trading patterns by joining trading communities, attending workshops, or practicing in virtual environments.
Trading combines art and science, so enhancing your skills could lead to success in this rapidly-evolving field of stock trading.

Frequently Asked Questions :
What Is a Dark Cloud Cover Pattern?
Answer :
- A Dark Cloud Cover pattern is a bearish reversal pattern found after an uptrend has reached a significant degree on a chart.
- It consists of a bullish candle followed by one that opens higher but closes at least halfway down its body of the first candle all within 24 hours after opening higher than previous day’s close but before reaching day close of first candle.
How often does the Dark Cloud Cover pattern occur?
Answer :
- It varies across markets and time frames, yet often enough that traders should monitor it as potential indicators for trend reversals.
Are Dark Cloud Cover Patterns Bullish or Bearish?
Answer :
- The Dark Cloud Cover pattern is bearish. It indicates an impending reversal from bullish to bearish market conditions, acting as a warning signal when seen during an uptrend and acting as an indicator that bears may soon take control.
- By recognizing this pattern traders become alerted of an impending downturn and can take steps to protect themselves or look for opportunities in any potential changes to market direction.
Can the Dark Cloud Cover pattern be applied to both stocks and forex trading?
Answer :
- Yes, the Dark Cloud Cover pattern applies across various financial markets both stocks and forex. Traders should take note of market’s volatility and liquidity when interpreting this pattern.
Why is It Essential to Combine Additional Indicators With the Dark Cloud Cover Pattern?
Answer :
- Utilizing additional indicators helps validate the signal provided by Dark Cloud Cover pattern, decreasing risk and improving effectiveness through confirmation of trend changes or continuation patterns.
What Should I Do if I See a Dark Cloud Cover Pattern?
Answer :
- Once you spot a Dark Cloud Cover pattern, take it as a signal that you should exercise extra caution if you’re holding long positions.
- Traders usually look for additional technical indicators or market news before making decisions regarding whether to enter short positions, set stop-loss orders, or take profits on existing long positions.
What Is the Dark Cloud Cover Pattern Theory ?
Answer :
- The Dark Cloud Cover pattern is based on market sentiment and investor psychology, signalling a change from bullish to bearish sentiment.
- An uptrend with large bullish candlesticks signals strong buying pressure but when subsequent candlesticks open above previous close and then close significantly into a bullish candle’s body without closing beyond previous close.
- It signals increased selling pressure that suggests investors doubt its sustainability and may signal bears taking over and signalling market reversal traders using multiple indicators together with this pattern can better anticipate market shifts while adapting their strategies accordingly.




1 thought on “Dark Cloud Cover Pattern – Best Definition 2024”