Understanding The Bullish Pennant Pattern : A Beginners Guide
For traders, price movement prediction is mostly dependent on technical analysis.
- The Bullish Pennant Pattern is one such pattern that traders usually watch for, this blog post will examine its formation and how traders can use it to make effective trading decisions.
- Learn about and trade the continuation pattern of an uptrend, the Bullish Pennant. Unlock simple techniques for recognizing and trading this pattern using volume as confirmation of its formation.
Get answers to frequently asked questions regarding this formation pattern while expanding your trading knowledge.
Definition of a Bullish Pennant Pattern :
- A short consolidation stage analogous to a pennant precedes the Bullish Pennant Pattern, a continuation pattern observed during an uptrend, before the pattern breaks out to the upside and keeps moving upward.
- Given that price will resume its upward trend after consolidating during this phase, traders view this pattern as bullish in nature.
Development of the Bullish Pennant Pattern :
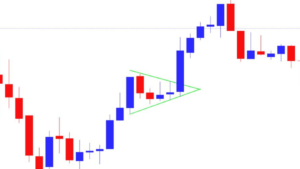
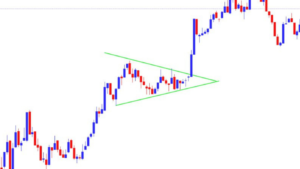
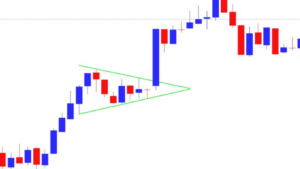
- A flagpole, or sharp price rise, is followed by a consolidation phase during which converging trend lines form to form pennant-shaped triangles. This is a brief stop before prices resume their upward trend.
Essential Features of the Bullish Pennant Pattern :
- Flagpole : Consistently rising highs and lows, indicating intense purchasing pressure, characterize the flagpole, an initial fast price rise that precedes the consolidation phase.
- Pennant : During the consolidation phase, the pennant—which indicates less selling pressure—is formed by joining swing highs to swing lows and displaying reduced volatility and trading range.
- Volume : Confirming this pattern is the tendency of volume to decrease during pennant formation.
Identifying the Bullish Pennant Pattern :
- Flagpole : A flagpole that indicates quick and significant price increases.
- Pennant : Pennant-like symmetrical triangular formation during consolidation stage. In this stage, volume is decreasing.
Trading Strategies with the Bullish Pennant Pattern :
a) Entry :
- When prices break out above the upper trend line of the pennant pattern and volume increases to confirm bullish momentum, traders can enter long positions.
b) Stop-Loss :
- To manage risk effectively, traders can set a stop-loss order just below its lower trend line to serve as support – any time prices break below this line may signal its failure of pattern formation and lead to its breakdown.
c) Take Profit :
- Traders may choose a take-profit objective depending on the risk-reward ratio or technical indicators employed in order to further maximize profit possibilities.
Limitations and Considerations :
- False Breakouts : Price breaking out of a pennant pattern but unable to maintain an upward trend is known as a false breakout, just as with any technical pattern. Trades should always be entered after confirmation.
- Time frame : Traders should modify their methods according to the time frame of consolidation phases, which can last anything from one day to many weeks.
How Does Trading Volume Affect Bullish Pennants?
- Volume is an integral factor when it comes to understanding and verifying a bullish Pennant Pattern.
Below is how trading volume affects Bullish Pennants:
Confirmation of Breakout :
- Once the market begins to break free from a Bullish Pennant Pattern, volume tends to surge as investors attempt to take advantage of it and move their positions out of its confines.
- A bullish pennant’s surge in volume signifies strong positive sentiment and buying pressure; traders who had been waiting to enter the market seize this momentous occasion to push prices higher.
- Therefore, an increase in volume during a breakout of a Bullish Pennant Pattern serves as confirmation and suggests its bullish momentum will likely continue.
Decreasing Volume during Consolidation :
- As another signal that a Pennant Pattern might be developing is falling volume as price consolidates
- When trading volume tends to decrease during consolidation phases, this often signals reduced selling pressure and lack of seller interest, this decrease is characteristic of pennant formation and serves as evidence that it’s being formed correctly.
Rapid Increase in Volume After Breakout :
- Once a market breaks out of its Bullish Pennant Pattern, volume quickly builds. This indicates a surge in buying activity.
- Combining a breakout with significant volume increases increases bullish sentiment and suggests further upward momentum.
- Trading volume is an integral factor in validating the Bullish Pennant Pattern, serving as confirmation signals during breakout and consolidation phase spikes and drops respectively.
What are potential consequences of high volume?
- The volume patterns allow traders to assess the strength of the pattern and make more informed trading decisions, whilst mitigating potential consequences associated with high volumes.
- Increased trading volume may have multiple ramifications across different contexts.
Few important things to remember are as follows.
1. Increasing Volatility :
- On the stock market, high trading volume can lead to more price volatility. This suggests that there are more active traders of the stock, which could result in larger price swings and changes in its value.
2. Liquidity and Efficiency of the Market :
- Generally speaking, a higher trade volume translates into more liquidity. Higher trading volume stocks are more liquid since liquidity describes how easily an asset can be bought or sold without appreciably affecting its price.
- These stocks frequently offer several buyers and sellers at any one time, which helps investors enter or exit positions without significant price disruptions, so enhancing market efficiency.
3. Confirmation of Price Movements :
- Volume can serve as an invaluable confirmation tool for price movements.
- A significant increase in trading volume accompanying any price movement indicates there is widespread market interest and conviction behind that move, helping traders assess its strength or identify possible reversals of a trend or identify potential reversals.
4. Market Sentiment and Breakouts :
- The volume should increase with each price move to verify whether market sentiment has truly moved as desired, whether that be upward, downward, sideways or sideways movement is taking place or vice versa.
- Trading volume can reveal information about possible breakout movements and market mood. A breakout is the price movement of a stock above a certain threshold.
- Higher trading volume during a breakout may signal more buying interest and additional price increases, low volume, on the other hand, may indicate indecision leading to false breakouts.
5. Impact on Bids and Asks Spread :
- The difference between the lowest price sellers accept (ask) and the maximum price a buyer is ready to pay (bid) might be indirectly benefited by high trading volume.
- Bid-ask spreads tighten more successfully in such equities as more buyers and sellers compete, which lowers transaction costs and benefits investors.
6. Impact on Call Trades :
- In call Trades, high call volumes present unique challenges if not managed effectively. It can increase customer wait times, decrease agent productivity, and put strain on customer relationships if not properly managed.
- Having effective strategies such as optimizing staffing levels and call routing systems in place are crucial in handling such call volumes effectively.
Conclusion :
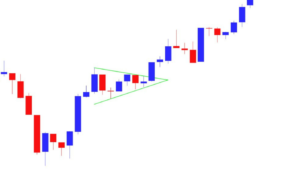
- The bullish pennant pattern could be a very useful instrument in a trader’s toolbox since it offers information about possible bullish continuation chances.
- Though no pattern ensures it, traders can raise their chances of success while reducing risk exposure by comprehending its formation and using suitable trading techniques.
Frequently Asked Questions :
What is a bullish pennant pattern?
Answer :
- A chart pattern called the bullish pennant pattern shows up during an upswing to suggest a brief consolidation or stop before price keeps rising.
How Can I Spot a Bullish Pennant Pattern?
Answer :
- A bullish pennant pattern is indicated by sharp price gains that create flagpoles and then periods of consolidation when prices take on a “inverse pennant” shape that resembles pennants.
What do high trading volumes signal in relation to a Bullish Pennant Pattern breakout?
Answer :
- High trading volumes confirm and suggest strong buying interest during its breakout, suggesting an uptrend continuation.
What is the significance of decreasing volume during consolidation phase of a Bullish Pennant Pattern?
Answer :
- Decreasing volume during consolidation indicates less selling pressure from sellers, further validating this pattern.
How Can I Trade the Bullish Pennant Pattern?
Answer :
- Traders may place take-profit objectives based on risk-reward ratios or other technical indicators and stop-loss orders below lower trend lines when price breaks out above the upper trend line together with increasing volume.


