Navigating Reversals With the Bullish Harami Pattern : Guide
- The financial markets is no simple task, so traders are constantly on the lookout for indicators of potential trend reversals in stock markets and here comes Bullish Harami an indicator that points towards potential trend reversals that signal potential shifts that provide early warning of financial market ebb and flows before becoming mainstream news.
- For traders with keen eyes who can identify details, this candlestick pattern holds hope of signaling such shifts long before mainstream news breaks.
Understanding the Bullish Harami Pattern is not simply about recognizing shapes on charts it requires deciphering market psychology. This comprehensive guide will walk you through all the intricacies of this pattern to help maximize trade effectiveness.
- Candlestick Patterns of Stock Market Price Movements Candlestick patterns are visual representations of price movements on the stock market.
- Originating in Japan during rice trading, they have since come to be recognized worldwide as an effective way of depicting complex market dynamics with just a simple visual analogy that of candlesticks.
- Understanding these patterns for traders is like learning another language each formation, shadow and color conveying specific messages about market activity.
- Statistics and evidence from traders support candlestick patterns as an indispensable tool in technical analysis.
- Not only do they show where prices have been, but also the power dynamics between bulls and bears, potential price movements and optimal timing of trades.
What Is the Bullish Harami Pattern?
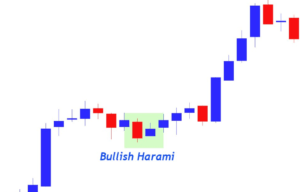
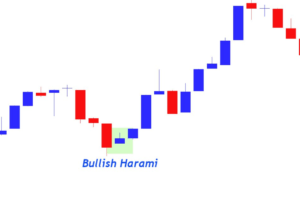
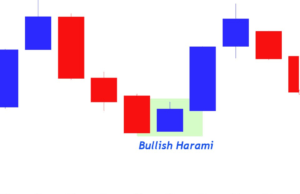
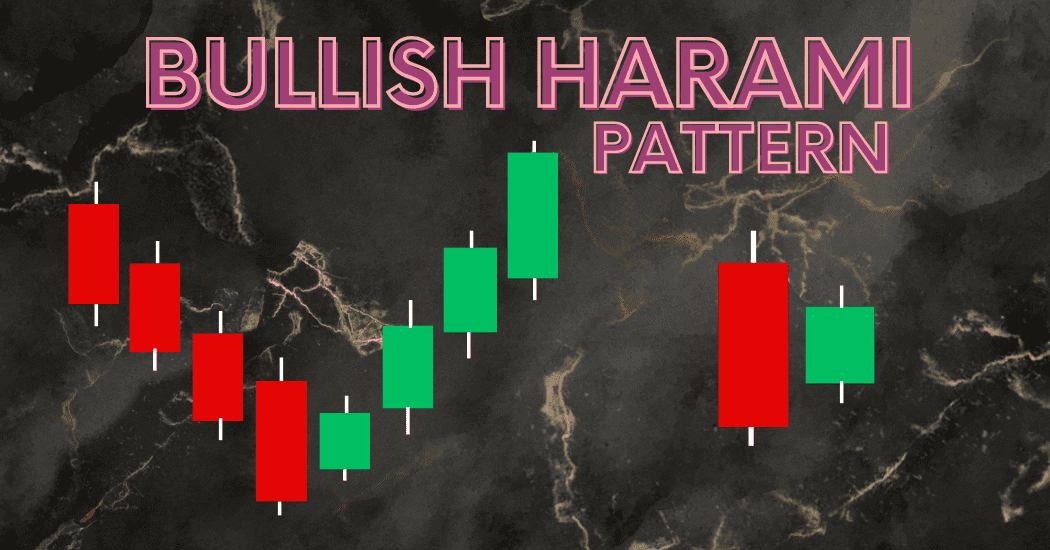
A Bullish Harami pattern is a two-candlestick formation which signals an imminent shift from bearish to bullish sentiment.
- Usually found at the end of a downtrend, this two candlestick formation comprises of an expansive bearish candlestick followed by a small bullish candle which engulfs its large body giving rise to a visual indication that could indicate market reversals ahead.
Discussing Elements of a Pattern :
- Bullish Engulfing Candle :- The first day of this pattern is marked by a large bearish candlestick that marks a strong sell-off and reinforces the current downtrend.
- Harami Candle :- On day two, there is usually a small bullish candle, completely within the body of its predecessor’s candle, that indicates decreased selling pressure or suggests market indecision between bulls and bears.
The smaller size indicates this is likely to indicate market indecision or an equal balance of power between bulls and bears.

Identification and Interpretation of the Bullish Harami :
Recognizing and Interpreting the Bullish Harami Understanding what implications this technical pattern holds is often easier said than done here is how to go about doing it correctly.
- To recognize a Bullish Harami pattern, it’s essential to search out its characteristic features. The smaller the second candle is, the higher its likelihood of reversal is.
- But simply recognizing this pattern alone won’t suffice traders must also evaluate where its formation fits within larger market context is it at a support level.
Misconceptions and Paths to Avoid Misinterpretation :
- One common misperception about Bullish Harami patterns is their isolated nature, traders frequently overlook price action preceding and following it, as well as possible confirmation signals.
- Context matters here such as volatility, volume and the various candlestick patterns which appear before and after it.
The Role of Volume and Confirmation :
- Volume as Confirmation Volume can act as an invaluable confirming indicator for Bullish Harami patterns. A pattern with high volume on its second, smaller candlestick can signal potential market reversals by showing evidence of new buyers entering.
Distinguishing Strong from Weak Signals :
A Bullish Harami with low volume may lack the conviction to produce a trend reversal, leading to false signals. On the other hand, high volumes on bullish haramis may signal the start of an uptrend with strong investor enthusiasm.
Strategy For Trading the Bullish Harami :
Trading with the Bullish Harami requires an effective approach to entry, exit and risk management. Here are a few strategies designed to help you use this pattern successfully.

Establishing Profitable Entries and Exits :
- One effective approach for setting profitable entries and exits is entering trades at the first sign of bullish momentum following the Bullish Harami pattern.
- Traders typically wait for price to trade above the high of the second day’s candle to confirm this pattern before entering their trades.
- Exit strategy planning is also key. Setting trailing stops or profit targets at each resistance level will enable you to secure gains if there is a successful reversal in price action.
Stop-Loss Orders Can Reduce Risk
Risk Mitigation with Stop-Loss Orders :
- Establishing a stop-loss order just below the low of a Bullish Harami pattern can provide protection from significant losses. Not all patterns lead to reversals, so it is vital that you manage your downside appropriately.
Case Studies and Real-life Examples :
To appreciate the power of the Bullish Harami pattern in action, here are several notable instances when this pattern predicted significant market movements.
Historical Events :
- Examining market events provides evidence that the Bullish Harami pattern foresaw major market upheavals such as the tech bubble burst and 2008, 2020 financial crisis, providing traders with advance warning to take appropriate actions in response.
Comparative Analysis in Different Market Environments :
- The Bullish Harami is not restricted by market type, it can be observed both in developing and mature markets with differing degrees of significance. By analyzing its appearance across varying scenarios, one can gain valuable insights into its adaptability.
Pitfalls and Challenges :
- Although powerful, the Bullish Harami can’t always provide accurate predictions. Its effectiveness depends on multiple factors and over-reliance can lead to misinterpretation of data. Therefore, understanding these challenges in order to use this pattern effectively.
Overcoming Common Mistakes when Trading the Bullish Harami :
- Relying solely on the pattern to analyze can lead to inaccurate analysis. Therefore, traders must supplement their study of the Bullish Harami with additional tools such as trend lines, moving averages, and relative strength indexes for complete evaluation of its significance.
Navigating Overconfidence :
- Success with Bullish Harami trades may give rise to overconfidence and lead to complacency. Therefore, it’s essential that this pattern be implemented within an overall trading strategy for best results.

References and Further Reading :
- For further insight into the Bullish Harami and other candlestick patterns, there are various resources available.
Books and Websites for Further Analysis :
- Reading up on candlestick patterns through books and trustworthy financial websites can provide in-depth knowledge of candlestick charts.
- Look for authors with extensive market experience or websites offering educational material that offer more in-depth learning opportunities.
Interactive Tools and Charts to Aid Visual Learning :
- Visual charting tools can enhance your ability to recognize candlestick patterns. Practise recognizing Bullish Harami patterns under real market conditions in order to build proficiency.
Continuous Education and Community Engagement :
- Joining trading communities or attending webinars can create an ideal learning environment, with peers exchanging insights and exchanging strategies related to the Bullish Harami pattern. You’ll develop greater insight and strategy.
- Applying candlestick patterns like the Bullish Harami requires skill and experience to master. Learning curves must be met daily cultivating knowledge should become part of daily routine.
- Although the path to successful trading may never be linear, this pattern can act as an invaluable guide along the way.
- Take the time to understand its implications carefully before integrating it into a solid trading strategy knowledge is power both financially and personally.
Conclusion :
- The Bullish Harami pattern is an invaluable asset in the toolbox of traders, providing insight into potential market reversals. By understanding its intricacies and being cognizant of its uses and limitations, traders can leverage its power effectively.

Frequently Asked Questions :
What happens after a bullish harami pattern forms ?
Answer :
- Once a bullish harami appears, it indicates an impending reversal of the downtrend, its effectiveness depends upon market conditions, volume and confirmation from technical indicators.
- After seeing such an formation occur, traders often look for follow through confirmation in the form of bullish price action afterward to confirm such predictions, they hope for price continuing upward and breaking through resistance levels to establish a new uptrend.
- However it should be remembered that not all bullish harami patterns lead to sustained up trends so traders should employ additional analysis and risk management techniques when making such assessments.
How accurate is the Harami Pattern ?
Answer :
- The accuracy of any Harami pattern, whether bullish or bearish, depends on various factors.
- While generally considered reliable reversal patterns, their effectiveness can depend on market conditions, time frame, confirmation from indicators, support levels or resistance levels reached and more technical signals such as oscillators trend lines volume analysis etc.
- The accuracy of any trading pattern also relies heavily on how it’s identified and interpreted within context of wider markets.
What Is A Bullish Harami And How Can It Be Recognized ?
Answer :
- A Bullish Harami is a candlestick pattern which indicates a potential market reversal from bearish to bullish conditions, identifiable by having its small body enclosed within the range of previous candlestick’s body, creating an appearance similar to being pregnant.
Is volume important when interpreting a Bullish Harami ?
Answer :
- Volume plays a pivotal role when interpreting Bullish Harami patterns, its higher volume on the day that Harami appears may serve as a strong indication of potential reversals.
Does the Bullish Harami pattern apply across all markets ?
Answer :
- Yes, this pattern can be observed across various asset classes including stocks, forex and commodities, its interpretation will however depend on market conditions as well as which asset you’re trading.
What are some common mistakes traders make when using the Bullish Harami pattern?
Answer :
- Mistakenly relying solely on the Bullish Harami without considering other indicators or factors may lead to misinterpretation and overconfidence due to a successful trade based on this pattern may lead to complacency and slipperiness in trading decisions.
How can a Bullish Harami pattern improve trading strategies ?
Answer :
- Add Bullish Harami analysis tools such as trend lines and moving averages to enhance your trading strategy, such as trend lines or moving averages, into your market analysis practice identifying it in real-time conditions, joining trading communities to share ideas and discuss strategies, and practicing it under real market conditions. Keywords


