Elevate Your Strategy with Bullish and Bearish Piercing Patterns :
Staring at a financial chart with its complex array of shapes, lines, and colors may be daunting for even experienced investors, yet within this maze lies an opportunity that could make or break your strategy:
- Bullish Piercing Pattern and Bearish Piercing Pattern are two powerful formations within candlestick chart analysis that may help elevate your strategy.
- This comprehensive guide will explore the intricacies of these two candlestick patterns. Not only will we look at what they are and how to identify them, but we will also examine their signals within your trading strategy.
- The dynamics of bullish and bearish piercing patterns in candlestick charting. Discover how these powerful reversal signals can indicate changes in market momentum, helping traders to identify entry/exit points during both Bullish and Bearish Piercing Patterns declining and rising markets.
- Through real-life examples, we will examine the behavioral traits of stocks displaying certain patterns, illuminating how these signals reveal market sentiment and potential price action in the near future.
- It isn’t simply about understanding patterns; rather it involves reading the language of the market in order to forecast its next turn or twist.
Candlestick Patterns: Illuminating the Path to Precision Trading
- Before diving deeper into Bullish and Bearish Piercing Patterns, it’s essential that we first grasp their role within candlestick patterns as an overall concept.
- Candlestick charts have long been considered an indispensable way to capture the human psychology behind trading.
- Each candle with its wick, body, and shadow tells a tale of market players’ battle between bears and bulls for dominance, these battles can often be reduced down to formations known as patterns categorized and studied for centuries.

Understanding Bullish Piercing Pattern :
Defined A Bullish :
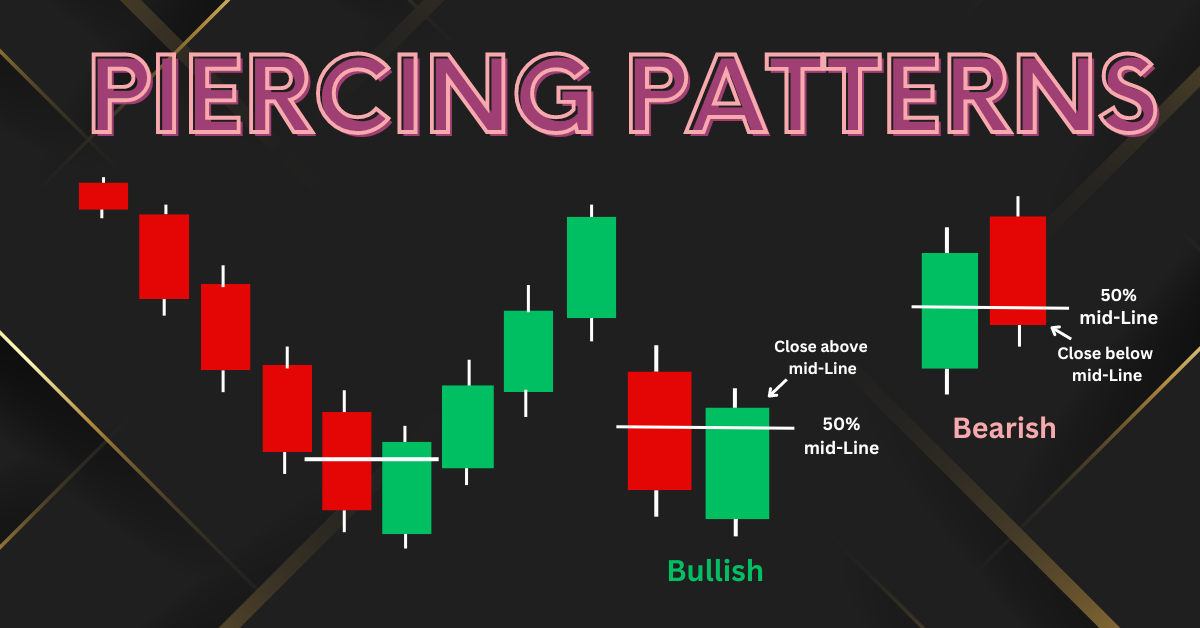
- Piercing Pattern is a two-candle formation seen at the end of a downtrend. The first candle, known as a bearish one, displays clear downward price movement while its counterpart opening below its predecessor signalling gap down.
- Over the course of trading sessions however, bulls rally back up and close it at least halfway up its body.
Traits and Significance :
- This pattern’s significance lies in the second day’s price action, showing that bulls have gained significant strength. The more powerful its reversal may be;, longer bodies and shorter lower wicks typically indicate this effect.
- It often serves as an indicator that selling pressure has been overcome by buying interest, potentially leading to an upward move in stock price.
Trading Strategies and Tactics :
- A Bullish Piercing Pattern strategy requires entering long positions at the opening of the candle after it forms, with targets set just before major resistance levels and stop loss orders placed below the low of the second candle for risk management purposes if any false signals arise from it.
Real-Life Examples and Analysis :
- Analyzing historical charts can give the Bullish Piercing Pattern real world evidence.
- For instance, stocks in an established downtrend may form such patterns before experiencing an upward movement triggered by changes in market sentiment or company announcements.
- By studying volume during the pattern, traders can ascertain its intensity. A strong increase in volume on the second bullish day provides additional proof of its efficacy.

Uncovering Bearish Piercing Pattern :
Unpacking its Formation :
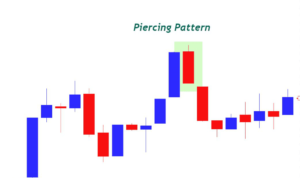
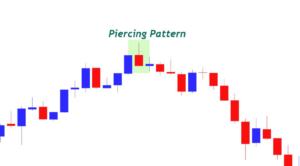
- The Bearish Piercing Pattern consists of two candles that form at the peak of an uptrend, signifying its possible reversal.
- It forms when price begins moving upward, followed by two bullish candles which open above their high, demonstrating a gap up before bears bring prices down and close half way through each of their bodies before closing them all off with another set of bear candles just like its counterpart, but in reverse.
- It occurs at either extreme of an uptrend. It forms at either extreme both Bullish and Bearish Piercing patterns indicate potential reversals.
- It forms at either extreme, signalling potential reversals at their respective peaks to indicate potential reversals at those peaks indicating potential reversals at these points where upward trends peaked before any major upswing reversals have taken hold either way before their bodies met halfway.
Characteristics and Implications :
- The second day of a Bearish Piercing Pattern’s second day symbolizes a significant loss of bullish momentum, prompting selling pressure that may eventually start a downtrend.
- Piercing depth plays a pivotal role here; an close near the low of the initial candle can signify strong reversals, this pattern acts as a bearish indicator warning traders that upward trends could soon be exhausted.
Tactical Approaches and Position Management :
- Traders responding to a Bearish Piercing Pattern could take steps to open short positions near the open of the third day after it appears, with their target price set just above any significant support levels.
- Stop-loss orders should be set above the high of the second candle to manage risk as failure of this pattern might mean continued bullish activity.
Application in Real-Time Scenarios :
- In real life, Bearish Piercing Patterns may arise after significant events that shake investor trust in a stock.
- For example, unexpected poor quarterly results released after closing bullish days could trigger such patterns, signalling market participants’ sudden change of sentiment.

Pinpointing and Confirming Bullish and Bearish Piercing Patterns :
Unveiling Piercing Bullish and Bearish Patterns Precisely :
- Tracing piercing patterns requires patience and precision. Key indicators to look out for include candle size and any significant gaps up or down the larger their real body compared to their wicks is, the stronger its signal; similarly a gap between first and second candles gives weight to formations.
Utilizing Volume and Other Indicators :
- Volume analysis can be an essential element in validating the strength of a Piercing Pattern. An increase in volume on the second candle can confirm this reversal pattern, suggesting widespread market interest in its implementation.
- Traders may also look to indicators like Relative Strength Index (RSI) to confirm overbought or oversold conditions as well as MACD for momentum confirmation purposes.
Common Mistakes to Avoid :
- Common mistakes traders should try to avoid include over-analyzing or being too eager to enter a trade. Furthermore, no pattern should ever be taken as definitive proof; always seek confirmation from multiple sources as part of your research process.
- Finally, understanding how a pattern fits within its wider market environment and within a stock’s historical performance also plays a vital role.
Comparing Bullish and Bearish Piercing Patterns :
Assessing Signal Strength and Timing :
- Understanding the significance and timing of Bullish and Bearish Piercing Patterns is of utmost importance in trading.
- A Bullish Piercing Pattern emerging at the end of an downtrend suggests a trend reversal, making an ideal entry point when completed, by contrast.
- Bearish Piercing Patterns emerging at the end of an uptrend signal potential peak levels and are best applied before any subsequent downward resumption in price action.

Impact on Trading Decisions :
- Due to the diversity of these Bullish and Bearish Piercing patterns, traders must adjust their strategies accordingly.
- When trading Bullish Piercing Patterns, traders should exploit any potential price gains while with Bearish Piercing Patterns the goal is selling high to maximize a move from peak to trough that may follow the pattern.
Understanding Piercing Patterns as Part of a Trading Strategy :
From Signal to Strategy :
- Integrating Bullish and Bearish Piercing Patterns into a wider trading strategy requires taking an organized approach.
- Traders should look for these formations at support and resistance levels as well as market trends, then use these patterns to fine tune their entry and exit points within longer-term strategies.
Integrating Bullish and Bearish Piercing Patterns Into Broader Analysis :
- While Piercing Patterns can be effective indicators, they shouldn’t serve as the sole basis for making trading decisions.
- Instead, other considerations, including market context and fundamental analysis as well as behavior of related stocks must also be examined to improve odds of success and to increase odds of success overall.
- A holistic approach is always more reliable than depending on a single signal alone.
Setting Entry and Exit Points :
- Execution of trades based on Bullish and Bearish Piercing Patterns requires pinpoint accuracy when setting entry and exit points.
- Traders should aim for entry points offering optimal risk/reward ratio, along with setting target prices based on support/resistance levels, while placing stop-loss orders to reduce risks.
Risk Management with Stop Loss Orders :
- Effective risk management is at the core of every successful trading strategy.
- A stop-loss order placed just beyond an entry point can protect against significant adverse price movements; when applied to Bullish Piercing Patterns, placing this stop-loss near its lowest low is usual while with Bearish Piercing Patterns it may warrant placing it near its highest high during pattern formation.
Conclusion :
- Candlestick patterns like the Bullish and Bearish Piercing Patterns offer traders invaluable insights into market sentiment and price movements in the near future.
- By mastering these formations, traders can add another useful tool to their technical analysis arsenal.
- But patterns alone do not guarantee success as a trader; an understanding of market dynamics, continuous learning and taking a systematic approach are required for effective trading.
- Engage with the market regularly, learn from both Bullish and Bearish Piercing Patterns your successes and failures and adapt your strategies in response to an ever-evolving financial landscape.

Frequently Asked Questions :
What Is Candlestick Pattern Analysis?
Answer :
- Candlestick patterns are visual depictions of price movement within financial markets that allow traders to predict future price directions based on historical patterns.
Are Bullish and Bearish Piercing Patterns Reliable Prediction Tools?
Answer :
- Candlestick patterns have long been recognized as reliable indicators when used alongside other tools for technical analysis such as volume indicators and trend analysis.
Can Beginners Implement Bullish and Bearish Piercing Patterns into Their Trading Strategies?
Answer :
- Yes, beginners may incorporate piercing patterns into their trading strategies – though practice on a demo account first in order to gain an in-depth knowledge of market context before using these patterns in live trading.
Why Is Volume Important When Analyzing Bullish and Bearish Piercing Patterns?
Answer :
- A noticeable increase in volume during the formation of a Bullish and Bearish piercing pattern can provide evidence of its strength and the possibility for market reversal, making it a key element in analysis.
How Can I Advance My Education on Candlestick Patterns and Technical Analysis?
Answer :
- To expand your understanding of candlestick patterns and technical analysis, engaging with various resources – books, online courses, forums, as well as practical trading experience is the best way.


