Understanding Bullish And Bearish Pennant Patterns for Traders :
Understanding Technical Analysis Trading requires knowledge of technical analysis for effective decisions.
- Of the many patterns traders consider, bullish and bearish pennant patterns stand out as key indicators of potential market movements and continuation in an asset’s price trend.
- Among the numerous patterns that traders take into account, delves deeper into both bullish and bearish pennant patterns their significance, and how traders can use them to maximize profits.
Explanation Of Bullish and Bearish Pennant Patterns :
Identification of a Bullish Pennant :
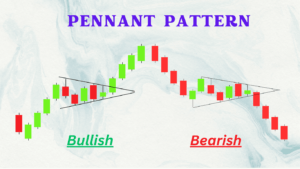
- Bullish pennant is a continuation pattern found during strong up-trends. It typically forms after significant price increases followed by brief consolidation periods before continuing upward. Here’s how to spot one:
Formation and Characteristics :
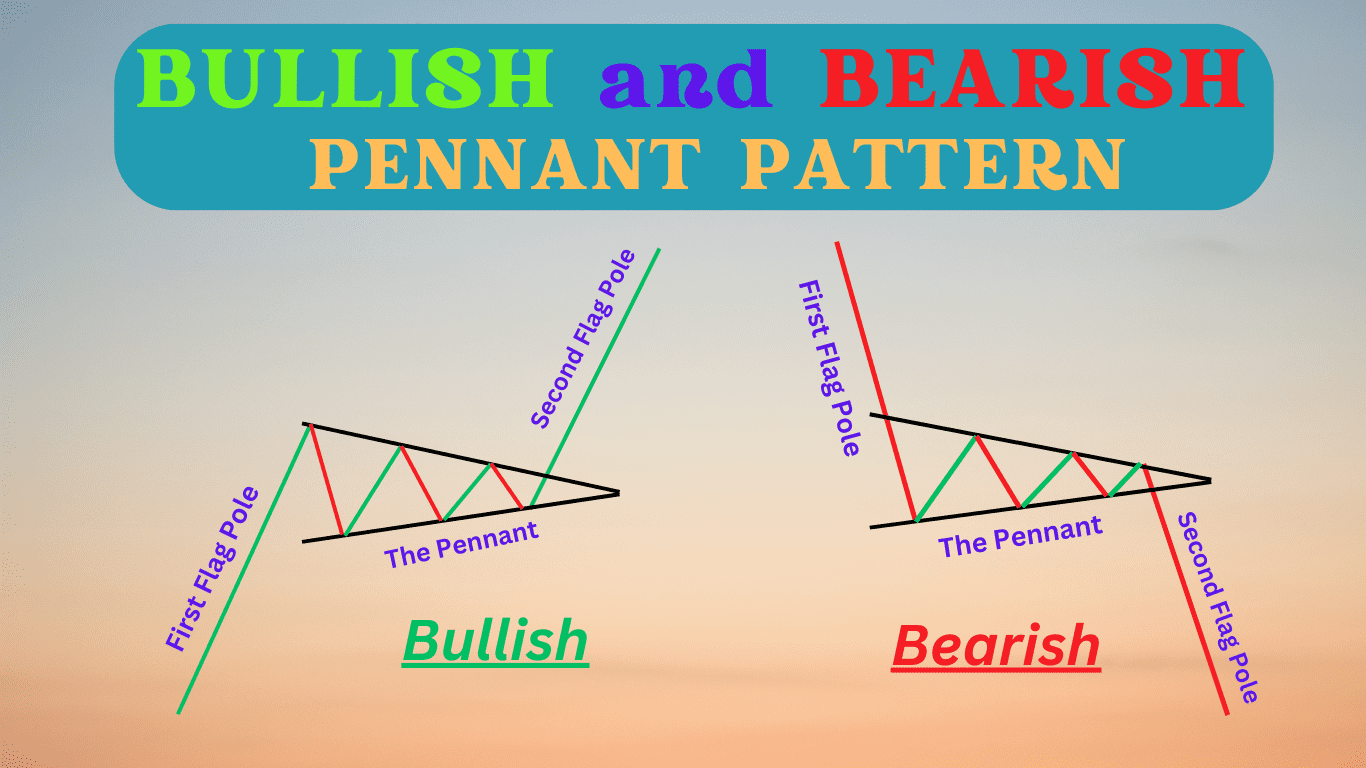
- 1. Sharp Price Increase : This pattern begins with an abrupt, upward price movement known as the flagpole.
- 2. Consolidation Phase : After its initial surge, price settles within a small symmetrical triangle, representing indecision among traders.
- 3. Decrease in Trading Volume : As consolidation unfolds, trading volume typically decreases.
- 4. Breakout : Once price breaches above the upper trend line of a triangle and breaks free, usually with accompanying spike in volume growth, then this pattern completes.

What Does it Signify :
- A bullish pennant signifies positive market sentiment during periods of consolidation, suggesting that assets may continue their upward journey after emerging from this zone.
Identification of Bearish Pennant :
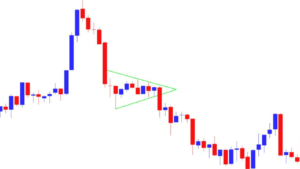
- A bearish pennant is the opposite of its bullish counterpart and occurs during downtrends. It indicates that further losses will likely follow any short consolidation periods.
Formation and Key Features :
- 1. Sharp Price Decrease : This pattern begins with an abrupt and significant downward price movement, creating the flagpole.
- 2. Consolidation Period : Following this initial move, price consolidates in a small symmetrical triangle to indicate temporary equilibrium.
- 3. Volume Decline : Trading volume typically decreases during the consolidation phase.
- 4. Breakdown : The triangle pattern ends when its price breaks below its lower trend line with increased volumes.
Implications for Traders :
- Bearish pennant suggests that sellers remain in control, even though the asset’s price appears to temporarily consolidate.
- This trend suggests that its price will probably keep declining after it exits its consolidation zone.

How to Trade the Pennant Pattern :
Trading Patterns of Pennants It takes extensive understanding of risk management techniques and entry and exit points to trade pennant patterns.
Here is a practical guide :
Entry Points :
- Bullish Pennant : To enter long positions when price breaks out above the upper trend line with increased volume.
- Bearish Pennant : When price breaks below its lower trend line with increased volume, enter short positions as soon as price breaks through to either of them with an increase in volume.
Exit Points :
- Bullish Pennant : Use trailing stops as price climbs or set a profit target equal to the length of the flagpole plus breakout point.
- Bearish Pennant : Set up trailing stops to safeguard profits as prices drop and a profit objective that is equal to the difference between flagpole length and breakdown point.
Stop-Loss Strategies :
- To block possible slippage in price action, set a stop-loss order below or above either the lower trend line in a bullish pennant (for bullish pennants).
Risk Management :
- When setting risk limits and managing positions, use position sizing and risk-reward ratios to ensure no single trade significantly alters your portfolio.
- A popular rule is the 1% risk, risk no more than one percent of capital on any single trade.
Real Life Examples :
Let’s examine historical market data as an illustration of pennant patterns‘ application in actual trades:

Bullish Pennant in Apple Inc :
- Formation : Apple had a sharp price increase in the middle of 2020 that served as its flagpole, after that, the price fell into a symmetrical triangle shape.
- Entry : Those that identified and acted upon the bullish pennant of the price could take long positions.
- Outcome : when it broke above the upper trend line with higher volume and maintained its upward march.
Bearish Pennant in EUR/USD currency pair, :
- Formation : The flagpole shape was formed in 2018 when EUR/USD underwent a sharp decline during a time of severe market volatility. Subsequently, price found its footing and stabilized within a small triangle pattern.
- Entry : When price breached below its lower trend line traders could enter short positions.
- Outcome : The EUR/USD pair continued its downward spiral, validating the bearish pennant pattern.
Pennant Pattern During the 2008 Financial Crisis :
- Formation : Plenty of stocks and indexes displayed bearish pennant patterns with disastrous outcomes during the 2008 financial crisis.
- Example : After the S&P 500 index fell drastically for instance, there was a period of consolidation.
- Entry : As soon as this consolidation phase ended, traders could short the market upon its breakdown, managing risk efficiently by shorting.
- Outcome: Investors who recognized the bearish pennant pattern could have mitigated losses and taken advantage of further declines,
Recent Example Amazon Inc :
- Formation : In early 2021 experienced an explosive price rise, that time Amazon displayed a bullish pennant formation.
- Entry: Traders could enter long positions upon a breakout above the upper trend line.
- Outcome: This pattern created profitable opportunities for traders who entered long positions upon breaking through its upper trend line.
Conclusion :
Recognizing and trading bullish and bearish pennant patterns can significantly bolster your trading strategy.
- They offer valuable insight into potential market continuations with well-defined entry and exit points.
- As you develop your trading skills, consider using advanced tools and platforms to increase your analytical capabilities.
- To enhance technical analysis and increase trading outcomes, sign up for Jasper for free today and gain access to an abundance of resources specifically designed to up your game!
- Master the bullish and bearish pennant pattern and stay one step ahead of the market by becoming adept at its use. Good trading.

Frequently Asked Questions :
What in trading is a pennant pattern?
Answer :
- A continuation pattern in technical analysis, a pennant pattern signals a break in a well-established price trend.
- Sharp price swings followed by a time of consolidation shaped like a little symmetrical triangle are signs of it.
- Ultimately, these patterns often end in breakout in favor of their prior trend direction.
How can I differentiate between bullish and bearish pennant patterns?
Answer :
- After a large upward price movement, a bullish pennant forms and shows that the rise will continue by having a symmetrical triangle or downward-sloping triangle during the consolidation stage..
- Conversely, bearish pennants form after substantial downward price moves and suggest their continuation typically featuring an upward-sloping or symmetrical triangle during their consolidation stage.
What role does volume play in validating Bullish and Bearish Pennant Patterns?
Answer :
- Volume is an indispensable element in validating bullish and bearish pennant patterns. As volume decreases during consolidation phases, signaling temporary equilibrium.
- Afterward, breakout or breakdown with increased volume confirms the pattern by signalling that its prior trend could continue into its next stage of development.
What are the Key Entry Points for Pennant Patterns?
Answer :
- In general, for bullish pennants to form, take long positions when their price breaks above its upper trend line with increased volume, similarly bearish ones should open short positions when their price breaks beneath its lower trend line with increased volume.
How can I set profit targets and stop-loss orders when trading pennant patterns?
Answer :
- Bullish pennants require setting profit targets equal to adding the length of the flagpole to the breakout point, for bearish ones, subtract it.
- Stop-loss orders should be placed just below or above either trend line in order to limit potential losses.
Can bullish and bearish pennant patterns be applied across different trading markets?
Answer :
- Indeed, bullish and bearish Pennant Pattern they work well in the markets for trading stocks, currency, commodities, and cryptocurrencies.
- For traders in every specific market, their effectiveness in forecasting market continuation makes them priceless instruments.


