Learn Bullish and Bearish Harami Cross Patterns : Trading Insights
Candlestick patterns are powerful tools in any trader’s toolkit, offering valuable insights into market sentiment and potential trend reversals.
- Of the numerous candlestick formations, two major patterns worth understanding for traders are Bullish and Bearish Harami Cross formations.
- We will go deeper into Bullish and Bearish Harami Cross both of them here with their characteristics, interpretations, applications to stock, forex, and crypto markets, plus how you can utilize them more efficiently when trading.
In this comprehensive guide we’ll examine them closely as an element of stock trading strategies across stock, forex, crypto markets.
Understanding Candlestick Patterns :
Candlestick patterns are visual depictions of price movements in financial markets, depicting open, high, low, and close prices of assets over a specific time frame.
- By studying their shape, color, and position in relation to each other, traders can gain valuable insights into market psychology as well as potential future price changes.
Its One such pattern is called a Bullish Harami Cross which shows price movement within this particular time frame.
The Bullish Harami Cross :

Formation and Characteristics :
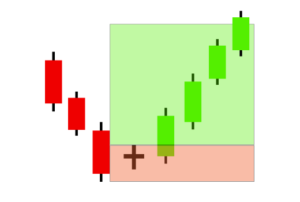
The Bullish Harami Cross is an eye-catching two-candlestick pattern, typically appearing after an extended downward trend has taken hold and signalling potential reversal or at least pause in that momentum.
- Consisting of two candlesticks, this dynamic duo’s existence may signal change or stoppage.
- The first indicator is a long bearish candle, which indicates continued selling pressure and reinforces the existing downward trend.
Subsequently, a second candlestick appears, distinguished by its strikingly small size either bullish or bearish that completely encompasses the preceding bearish candle’s body.
- Remarkably, the body of this second candlestick is minimal with open and close prices extremely close together, creating a cross-like appearance which lends the pattern its name.
Such formation indicates a shift in market sentiment as selling pressure begins to ease off while buyers show more interest, signalling potential bullish reversal in sentiment.
Interpretation and Trading Strategies :
A Bullish Harami Cross indicates a potential bullish reversal, suggesting that the current downtrend may be losing momentum.
- Its small second candle illustrates indecision among market participants with neither bulls nor bears taking control.
- Before entering long positions on such signals, traders typically wait for confirmation such as increased buying volume or breaking above the high of the Bullish Harami Cross to confirm reversals before entering long positions.
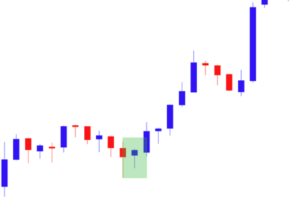
Example of Bullish Harami Cross Pattern [Insert Chart Showing Bullish Harami Cross Pattern Slightly Different Version –
The Bearish Harami Cross :

Formation and Characteristics :
The Bearish Harami Cross candlestick pattern represents the opposite sentiment to its bullish counterpart.
- This trend pattern often emerges after periods of up-trending in the market, signalling potential reversals or pauses in bullish momentum.
- It is distinguished by a long bullish candle which indicates strong buying pressure followed by another shorter candle which could either bearish or bullish but which completely covers up its predecessor’s body and signals decreasing buying power, suggesting it could soon reach a turning point in its journey upwards or downwards.
Bearish Harami Cross candles stand out with their small bodies that feature nearly identical opening and closing prices, resembling either a Plus sign or Cross.
- This signifies indecision in the market as prices did not shift significantly in either direction between opening and closing of trading period.
- After an uptrend has been sustained for an extended period, this pattern serves as a warning signal that could indicate the current bullish trend is losing steam.
Traders typically look for additional confirmation through subsequent trading sessions in order to ascertain if an actual trend reversal has taken place or whether bullish momentum will persist regardless.
Interpretation and Trading Strategies :
A Bearish Harami Cross can signal an impending bearish reversal, suggesting that the uptrend may be losing steam.
- The small second candle represents indecision or any shifts in market sentiment that might accompany it, traders typically seek confirmation of this reversal through increased selling volume or breaking below the low of the Bearish Harami Cross before entering short positions.

Comparing the Bullish and Bearish Harami Cross :
While Bullish and Bearish Harami Cross patterns involve an engulfment of a small candle by a larger one, their implications for market direction differ dramatically.
- While Bullish and Bearish Harami Cross patterns involve small candles being completely consumed by larger ones, their meaning and implications differ considerably in relation to market direction.
- Bullish Harami Cross patterns appear following periods of down trending and could indicate potential bullish reversals signalling that momentum may be slowing in this direction and rally could follow shortly.
- On the other hand, Bearish Harami Crosses identified after up-trends suggest possible bearish reversals which signal that momentum may be losing steam and decline could follow shortly afterwards.
Trading and investing professionals know that recognizing patterns is only the start.
- In order to make informed decisions and anticipate market movements more successfully, it’s critical to assess the market context as a whole before making any decisions.
This involves considering trends’ direction either up or down, trading volume analysis for further confirmation, technical indicators providing additional perspectives and other factors like this that allow traders to make more informed decisions more accurately and anticipate future movements more accurately.
Real World Examples :
Examples of successful trades which utilized Bullish and Bearish Harami Cross patterns, demonstrating their efficacy in trading:
- Provide an example of successful trading that utilized the Bullish Harami Cross pattern.
- This example should demonstrate its power to indicate an upward trend after a downward one and provide traders with an entry point for a long position.
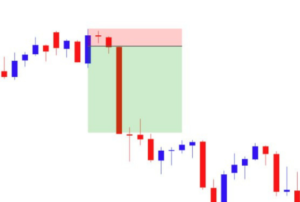
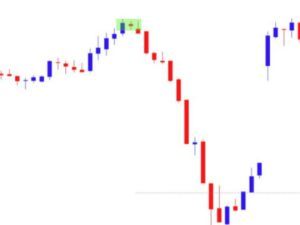
- This case will demonstrate how this pattern can signal an impending downtrend following an uptrend, providing traders with an opportunity to enter short positions strategically.

Bullish and Bearish Harami Cross
These examples demonstrate the significance of learning and applying these intricate candlestick patterns.
- By mastering Bullish and Bearish Harami Cross patterns, traders can significantly enhance their decision-making process for more informed trading strategies and potentially profitable outcomes.
Gaining such an insight not only expands one’s toolbox but also highlights market analysis’s nuanced nature.
Conclusion :
Candlestick patterns like the Bullish and Bearish Harami Cross provide traders with invaluable insights into market dynamics and potential trend reversals.
- By understanding their formation, characteristics, and interpretation, traders can make more informed decisions and develop effective trading strategies.
Be mindful to consider wider market context before acting upon such patterns.

Frequently Asked Questions :
What Is a Bullish Harami Cross Pattern?
Answer :
- A Bullish Harami Cross pattern is a candlestick formation which indicates an impending bullish reversal following a downward trend.
- It typically features one large bearish candle, followed by two smaller bearish candles resembling a cross, as if to indicate market indecision and market indecision.
What Is A Bearish Harami Cross Pattern?
Answer :
- A Bearish Harami Cross candlestick pattern signals a potential bearish reversal after an uptrend, consisting of two large bullish candles followed by one small one.
- This signal warns traders to prepare themselves for possible market downturn. It signifies market indecision as well as potential end of bullish momentum signalling traders to brace themselves for potential market downturn.
What makes the Bearish Harami Cross different from its Bullish version?
Answer :
- It indicates an impending bearish reversal when seen after an uptrend, consisting of two candles-one large bullish one small cross-like-one depicting weakening bullish momentum.
What do the small candles in Harami Cross patterns signify?
Answer :
- A small candle symbolizes market indecision as it shows that neither buyers nor sellers could significantly shift price away from its opening level, leading to an close near the opening level.
Is It Necessary to Wait for Additional Confirmation After Forming a Bullish and Bearish Harami Cross Pattern?
Answer :
- Yes, traders typically wait for additional confirmation, such as subsequent candles closing beyond either high or low of a Bullish and Bearish Harami Cross pattern, or changes in trading volume before making their trade decision.
Are these Bullish and Bearish Harami Cross patterns applicable in all markets?
Answer :
- While Bullish and Bearish Harami Cross patterns were first created for use in Japanese rice markets, they have since proven useful across a range of financial markets such as stocks, commodities and forex owing to reflecting universal market psychology.
Are Bullish and Bearish Harami Cross patterns reliable signals by themselves?
Answer :
- No single pattern can guarantee reliability on its own, while Bullish and Bearish Harami Cross patterns are considered strong indicators, their accuracy increases when used alongside other technical analysis tools and market context.
What steps can be taken to learn to identify Bullish and Bearish Harami Cross patterns?
Answer :
- Practice and education are crucial. Looking back over historical charts, participating in trading simulation exercises and making use of educational resources such as webinars or community discussions are great ways for traders to become adept at recognizing such Bullish and Bearish Harami Cross patterns.
What can I do if I miss an entry point after identifying a Bullish and Bearish Harami Cross patterns?
Answer :
- Market opportunities will always arise; instead of jumping quickly into any one position, take time to analyze the market for another suitable entry point or wait for another pattern that fits your trading strategy to develop.


