Mastering the Bullish and Bearish Flag Patterns : A Guide for Traders
- Learn to recognize and trade bullish and bearish flag patterns with our comprehensive guide.
- Discover strategies, risk management tactics, real-world examples and exclusive advice to increase technical analysis skills and maximize trading success.
Introduction to bullish and bearish Flag Patterns in Technical Analysis :
- Understanding chart patterns is crucial in trading, and flag patterns both bullish and bearish flag Pattern stand out among others as being particularly reliable and frequent in occurrence.
- bullish and bearish Flag patterns serve as continuation patterns that signal likely continuation of trend following periods of consolidation, day traders, stock market enthusiasts, Forex traders, investors, price action traders and technical analysts all depend on them when making informed trading decisions.
Learn Bullish Flag Patterns :
Definition and Characteristics :
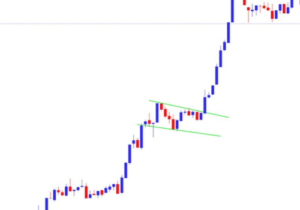
- An uptrend is the setting for the continuation pattern known as a bullish flag pattern.

Two primary components:
- Flagpole: This component corresponds to any sudden rallies or upward movement before the pattern emerges
- Flag: An area that slopes downward against the dominant trend and serves to stabilize.
How to Recognize and Interpret Bullish Flags :
- Bullish flag can be identified by its strong upward move (flagpole), followed by a gradual decrease before rising again quickly (flag).
- This pattern indicates buyers taking a breather before pushing prices higher again.
Key characteristics including:
- An abrupt and nearly vertical rise in price.
- An oscillation or trend line where prices move in an overall downward trajectory.
- Volume usually decreases during formation of the flag before experiencing dramatic spikes upon breakout.
Real World Examples
Case Study : Bullish Flag Pattern on Tesla in 2020.
- Tesla stock experienced a bullish flag pattern in early 2020. Aggressive rally from March to June, consolidation ensued before breaking out and continuing upward momentum, providing traders with an advantageous entry point.
Trading Strategies for Bullish Flags
- Entry Point : Enter long positions when price breaks above the upper resistance line with increased volume.
- Stop Loss : Place a stop loss below the lower boundary of the flag in order to manage risk and preserve profits.
- Profit Target : Measure the length of the flagpole and project this distance from its breakout point to set your profit target.
Understanding Bearish Flag Pattern :

Definition and Characteristics :
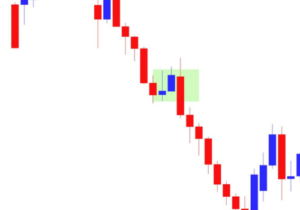
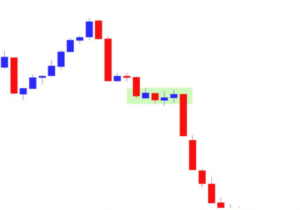
A bearish flag pattern is a continuation pattern seen during a downtrend that signifies further downward movement after brief consolidation. It consists of:
- Flagpole : This precedes sharp decline.
- Flag : An irregularly-shaped consolidation area which slopes upward against the dominant downtrend.
How to Recognize and Interpret Bearish Flags :
- Bearish flags can be identified by an abrupt downward price movement (flagpole), followed by an upward-sloping rectangle (flag).
- This pattern indicates an upswing before sellers drive prices back down further.
Key characteristics for bearish flags include :
- Steep, near vertical drops in price.
- Upward-sloping parallel channel or rectangle that extends upward.
- Decreasing volume during flag formation and increasing upon breakdown.
Real-World Examples :
Case Study : EUR/USD Bearish Flag Pattern in 2018
- In mid-2018, the EUR/USD currency pair displayed a bearish flag pattern on a 4-hour chart.
- After experiencing a rapid downward spiral, consolidation occurred within an upward-sloping channel before its subsequent break-off signaled further decline and offered profitable trading opportunities to Forex traders.

Trading Strategies for Bearish Flags :
- Entry Point : Launch a short position once price breaks below the lower support line of the flag with increased volume.
- Stop Loss : Put in place an exit stop loss above the upper boundary of the flag.
- Profit Target : Measure the length of the flagpole and project this distance from its breakdown point to set your profit target.
Compare Bullish and Bearish Flag Patterns :
Key Differences :
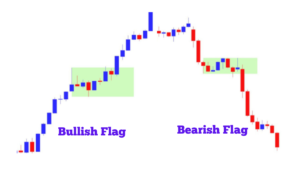
- Trend Direction : Bullish flags appear during up-trends, while bearish ones show during downtrends.
- Flag Slope : Bullish flags tend to slope downward while bearish ones veer upward.
- Market Sentiment : Bullish Flags indicates buying pressure has temporarily subsided or that selling pressure has temporarily subsided. Both bullish and bearish flag patterns share similarities which may help determine their interpretation.
Similarities :
- Formation : Both bullish and bearish flag patterns feature a flagpole followed by a rectangular consolidation area.
- Volume Behavior : Both bullish and bearish flag patterns often demonstrate an increase in volume during breakout/breakdown phases and decrease during flag formation phases.
- Continuation Signal : Both bullish and bearish flag patterns serve as continuation signals that suggest continuation of an underlying trend after brief consolidations.

The Importance of Flag Patterns in Trading :
Their Role in Predicting Market Trends :
- Patterns of Flags as Market Trend Prediction Tools Since flag patterns frequently indicate the continuation of a current trend, they can be very useful instruments in predicting market developments.
- Knowing these trends enables traders to take risks with acceptable risk-reward ratios.
Risk Management :
- Confirmations : For optimal trading success, wait for confirmation of a breakout/breakdown with increased volume before entering any trade.
- Stop-Loss Orders : Use stop-loss orders to manage risk effectively by placing them just outside the flag boundary to protect against false breakouts.
- Position Sizing : To prevent overexposure of trading capital to individual trades, employ proper position sizing techniques in your trading. Conclusion and Next Steps
Conclusion :
- Both bullish and bearish flag Patterns are essential tools for traders. They allow traders to predict the continuation of existing trends, providing opportunities for strategic entries and exits.
- Bullish and bearish flag patterns requires recognizing its flagpole and flag as well as potential breakouts/breakdowns before developing effective trading strategies to take advantage of such patterns.

Frequently Asked Questions :
How does one distinguish a bullish flag pattern from its bearish counterpart?
Answer :
- Bullish flag occurs during an uptrend and features a downward-sloping rectangular consolidation area that signals temporary buying pressure halt.
- Conversely, in downtrend markets where selling pressure increases dramatically a bearish flag appears instead, featuring an upward-sloping rectangular consolidation area signalling temporary selling pressure restraint.
How can I confirm the breakout or breakdown of a flag pattern?
Answer :
- Look for a rise in trading volume that corresponds with price movement outside the flag boundaries to confirm a breakout or breakdown, such a volume spike indicates strong market confidence and implies that future trend continuance will probably continue strong.
Where in trading both bearish and bullish flag patterns should I put my stop-loss?
Answer :
- Bullish flag patterns, place your stop-loss just below the lower boundary; while for bearish flag patterns place it above the upper boundary. This helps manage risk and avoid false breakouts.
How can I set my profit target when trading bullish and bearish flag patterns?
Answer :
- Just measure the length of the flagpole and project this distance from either its breakout (for bullish flags) or breakdown (for bearish flags) point to achieve your profit objective when trading flag patterns. This projection provides a realistic target based on previous price movements.
Can Flag Patterns Be Found on Any Time Frame?
Answer :
- Flag patterns can be found across a variety of time frames from 1-minute charts to daily ones.
- Their principles remain constant regardless of which timescale you analyze – however this could offer new trading opportunities depending on which time scale it occurs on.
Are bullish and bearish flag patterns always reliable?
Answer :
- Though most of the time accurate indicators of trend continuation, both bullish and bearish flag patterns, no trading pattern ensures success.
- Confirming signals and safeguarding money hence need the employment of more technical analysis tools and risk management techniques.


