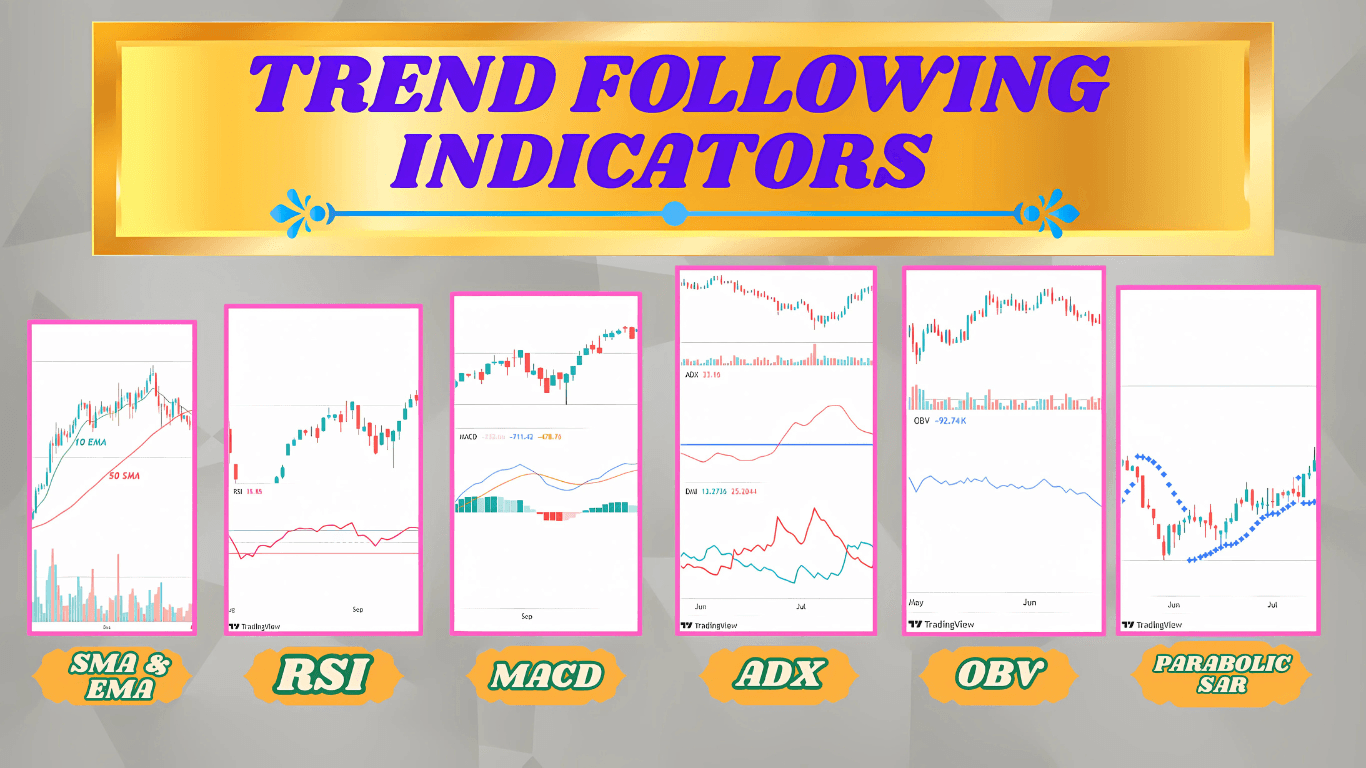
The Complete Guide for Trend Traders : Trend Following Indicators
Traders hoping to profit from market swings by spotting, verifying, and riding trends, trend following indicators are vital tools.
- These metrics are meant to cut through the noise of market moves and offer unambiguous indications to enable traders make wise decisions.
- These are some of the main trend following indicators signals that could strengthen trading plans and raise successful probability.
What is a trend following indicators ?
Whether bullish or bearish, trend following indicators guide traders toward market direction.
- These instruments rely on the theory that markets usually show regular trends, which helps traders to profit from these changes.
- Success depends on one mastering trend following indicators and trend trading strategies, which also provides insightful analysis of market dynamics.
The Basic Concept of Trends
It’s important to know what a trend is before delving closely into the signs themselves.
- In day trading, a trend is defined by a sequence of stock price swings that over a designated period show a consistent direction.
There are three primary categories for trend followers:
- Up Trend : Often driven by optimistic attitude, upward trend, indicates bullish trend is the phenomenon whereby prices are reaching higher highs and lower lows( Strong Uptrend).
- Down Trend : Conversely, a downward trend indicates bearish trend unfavorable bear market circumstances with lower lows and lower highs.
- Sideways Trend :In this case, prices fluctuate and show no obvious directional bias. Sideways trend.
Understanding these patterns and their underlying psychology will help a trader greatly increase his chances of making wise judgments.
Trend Following Indicators :
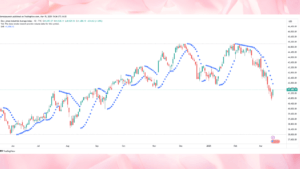
Parabolic Stop and Reversal (SAR) :
One important trend following indicator identifying possible market potential reversal points is the Parabolic SAR.
- Plotting dots above or below the price depending on the trend direction, below denotes an uptrend and above shows a downturn.
- As trends change, traders create trailing stops and mark entry and exit positions using the Parabolic SAR, therefore safeguarding gains.
Average Directional Index (ADX) :
The average directional index (ADX) quantifies trend strength in any direction rather well.
- It runs from 0 to 100, readings above 20 or 25 point to a clear trend.
- To evaluate both trend strength and direction, traders may combine the ADX with Directional Movement System (DMS) indicators +DI and -DI, therefore guiding better trading selections.
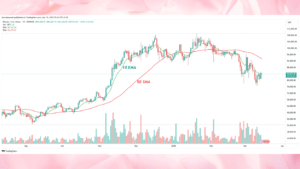
Exponential Moving Average :
For its sensitivity to recent price changes, the Exponential Moving Average (EMA) is a preferred trend following indicators.
- The EMA stresses the most recent prices while the Simple Moving Average (SMA) averages all values equally.
- This feature helps the EMA to effectively capture trend momentum, so allowing traders to respond faster to changes in the market.
Simple Moving Average :
One important trend following indicators tool for traders determining price direction over time is the Simple Moving Average (SMA).
- It calculates the security’s average price over a given period, therefore offering understanding of market price patterns.
- Though less sensitive to current price fluctuations than the EMA, this instrument is nonetheless a useful tool in many trading plans.
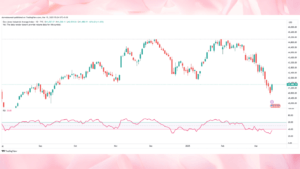
RSI: Relative Strength Index
A momentum oscillator, the Relative Strength Index (RSI) gauges the pace and change of price swings.
- Designed by J. Welles Wilder Jr., this indicator enables traders to spot overbought or oversold levels in a market, therefore guiding their selections on time.
RSI – How Its Works :
Usually spanning a designated period usually 14 days the RSI is computed using a formula comparing the average gains and losses during that period.
- The result falls on 0 to 100 range. The main calculations’ items of interest are:
- Determine Average Loss and Gain.
- You figure the average gain that is, the average of the rising closing prices and the average loss that is, the average of the closing prices that dropped throughout the designated periods.
Moving Average Convergence and divergence MACD :
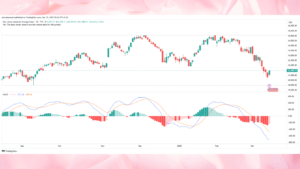
Trend following momentum indicator displaying the relationship between two moving averages of a security’s price is Moving Average Convergence Divergence (MACD).
- Originally created by Gerald Appel in the late 1970s, the MACD is especially useful for spotting variations in the strength, direction, velocity, and length of a active trend.
MACD – How its Work :
- Subtraction of the 26-period EMA Exponential Moving Average from the 12-period EMA computes the MACD. The MACD line shows this.
- Furthermore placed on top of the MACD line is a 9-period EMA, which serves as a signal line to spot possible buy and sell signals.
Applying the MACD :
There are various fundamental techniques traders can utilize to properly apply the MACD in trading.
- More informed trading decisions follow from knowing how to understand the fluctuations and trading signals of the MACD.
- The basic ideas below help one implement the MACD :
1. Crossover of Signal Lines :
Trading Signal line crossovers are among the most often used techniques for producing buy or sell signals using the MACD.
- A positive signal produced when the MACD line crosses above the signal line suggests that buying would be a wise move at this moment.
- On the other hand, a MACD line crossing below the signal line generates a negative indication indicating it could be time to sell or close a position.
2. Divergences :
When the MACD moves opposite from the asset price, divergences result.
- Hinting at a possible upward reversal, a bullish divergence results when prices reach a lower low and the MACD makes a higher low.
- On the other hand, a bearish divergence results from prices reaching a higher high while the MACD signals a likely decrease.
- Understanding these differences helps a trader to better forecast market reversals.
On-Balance Volume (OBV) :
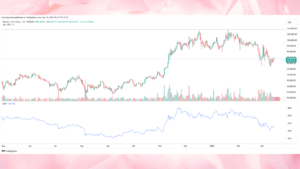
Another often used tool for trend following indicators tool that enables traders to spot price patterns depending on volume movement is on-balance volume (OBV).
- Originally developed by Joe Granville in the 1960s, OBV links volume and price variations based on theory that volume comes before price movement.
- This link lets traders decide on the direction of an asset depending on the trading volume gathered over the period of time.
OBV – How its work :
If the price finishes higher than the previous closing, the OBV indicator is computed by adding the volume of a trading day to the prior OBV number.
- Should the price drop, the volume is reduced. This basic method generates a sum reflecting buying and selling pressure.
The Purpose of Trend Following Indicators:
Trend following strategy signals enable trend trading traders to spot and validate patterns for well-informed judgments.
- They filter stock market noise to expose consistent price changes over time period, even with brief price swings. Their main purposes are these:
Signal Generation :
Trend following indicators guide on when to start or stop trading.
- When the price crosses above a moving average, for example, it could point to a purchase opportunity, crossing below recommends selling.
- By means of these indications, trend traders can make methodical decisions instead of depending just on gut feeling.
Validation of Trends :
Confirming a trend’s presence is absolutely vital before trading.
- Trend following indicators confirm uptrends or down trends, therefore lowering the false signals breakout risk and raising traders’ confidence.
- Rising average directional index (ADX), for instance, points to a strong trend that supports the trader’s position.
Additional Trend Following Indicators :
- Two other trend following indicators traders often use are the Moving Average Convergence Divergence (MACD) and On- Balance Volume (OBV).
- Excellent tools for verifying trends, spotting possible trend reversals, and improving trade plans are these indicators.
The Average Directional Index (ADX) :
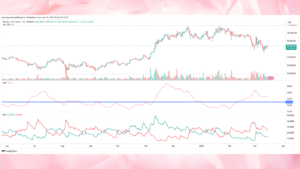
- The Designed to quantify the strength of a trend rather than its direction, the average directional index (ADX) is a trend following indicator.
- The ADX runs from 0 to 100, readings below 20 indicate a moderate trend while values above 25 point to a strong trend.
ADX – How its work :
- Two further indicators the +DI (Positive Directional Indicator) and -DI (Negative Directional Indicator) are used to compute the ADX by means of differences.
- An upswing is indicated when the +DI is above the -DI; a downtrend results from the reverse.
- The ADX verify the strength of the dominant trend,
for instance:
- Strong Trend: ADX more than 25, ADX less than twenty is a weak trend. Traders might combine the ADX.
- Using other trend indicators, trend following indicators helps trend traders one to improve their approach.
- To better timing their entries and exits, they might, for example, mix the ADX with relative strength indicators or moving averages.
Advantages of Trend Following Indicators :
Trend Following Indicators Advantages :
- Trend following indicators provide traders trying to negotiate the complexity of financial markets several important benefits.
- Here are some main advantages and the main causes behind the preference of many traders for trend following approaches:
1. Simple and clear signals :
- Usually depending on set principles, trend following indicators offer simple buy or sell indications.
- This simplicity enables traders to make fast decisions free from second-guessing of market fluctuations.
- Moving averages, for instance, clearly indicate when to start or stop a transaction, therefore lessening emotional decision-making.
2. Capturing Major Price Movements :
- Trend following indicators mostly aims to enter a market early in a trend to grab significant price swings.
- Early identification of patterns helps traders maybe profit from significant price fluctuations.
- Higher returns can result from this strategy than from more stationary strategies depending on minor price swings.
3. Reduced Noise :
- By helping to filter out market noise and small changes, trend following indicators enable traders to concentrate on the direction of the market generally.
- By smoothing out transient price swings, signals including
Disadvantages of Trend Following Indicators :
- Especially in volatile market situations, moving averages help to avoid being caught in erroneous signals that could frequently result in losses.
- Trend following indicators techniques do, however, have certain inherent drawbacks that traders should be aware of notwithstanding their many benefits.
Trend Following Indicators Disadvantages :
1. Lagging Signals :
- One main disadvantage of trend following indicators is their lagging character.
- Based on prior price data, they often indicate trend reversals only following changes, so missing opportunities or late trading openings that can lower profitability and raise risk.
2. False Breakouts :
- Trend following indicators techniques are not immune to false breakouts even if they might help filter market noise.
- Sometimes a price might momentarily exceed a level of resistance or support, which would cause indications from trend following indicators.
- Under these circumstances, traders may start a trade expecting a continuous march toward the breakout ( false signals )and find themselves disappointed with a rapid reversal costing losses.
3. Difficult in Ranging Markets :
- In turbulent or sideways markets where prices are not clearly trending Trend following indicators usually perform poorly.
Conclusion :
Basically, by spotting established price trends for possible gains, trend following indicators enable traders to profit from notable market swings. Still, one must understand their hazards.
- They have limits, including lagging signals and the possibility for false breakouts in volatile settings, even while they can record significant price movements and filter market noise.
- In sideways markets, their performance could drop, leading to unpleasant trading results.
- Traders should so carefully employ these indicators, integrating them with other analytical tools and risk control techniques.
- In the end, effective trading depends on knowing the advantages and drawbacks of many approaches and adjusting to changing market conditions while improving trading abilities.
