Introduction : Top Candlestick Patterns
The vast ocean of technical analysis, Top candlestick patterns stand out as islands of information that serve as guides to market movement.
First developed by rice traders in ancient Japan, these visual representations of asset prices have since become indispensable tools for modern stock market participants.
Though seemingly simple in appearance, candlestick patterns tell a complex narrative reflecting collective thoughts and actions in the market place.
Candlestick Patterns in Trading
Since their origin in Japan during the 18th century, candlestick patterns have proven themselves as reliable tools of analysis for traders of all stripes worldwide.
These patterns serve as both visual representations of price movements as well as expressions of market psychology, reflecting fear, greed and consensus among traders.
This guide seeks to demystify candlestick patterns, taking you from their historical roots all the way through to modern trading strategies that utilize them.
No matter whether you’re just beginning or looking for ways to enhance your strategy, this exploration of top candlestick patterns will illuminate a path toward more informed and effective trading decisions.
The Art and Science of Candlestick Patterns in Trading
Finance is defined by an ever shifting stock market where waves of opportunity collide against risky investments.
Within this dynamic expanse, Top candlestick patterns offer guidance to market navigators by offering insights into investor sentiment, market psychology and potential price movements.
This long-form blog dives deep into candlestick charting by exploring its rich historical legacy, deciphering common patterns as well as providing strategies to use these formations effectively in trading strategies.
Why They Matter
Candlestick patterns matter because they encapsulate trading behavior within an easily digestible price unit (time frame) and condense market psychology into visual shapes.
Understanding and reading top candlestick patterns gives traders a significant edge in anticipating price movements and making informed trading decisions.
Art of Interpretation
Candlestick pattern interpretation is both an art and science. To do it successfully, traders must recognize shapes while also understanding where and why they appear in context.
They need to determine whether each pattern represents an end or beginning trend reversal or simply indecision in the market.
History and Evolution of Candlestick Patterns in Trading
To fully grasp the significance of candlestick patterns in trading, it’s necessary to trace their history.
Top Candlestick patterns first gained widespread acceptance through their development by a Japanese rice trader named Munehisa Homma in 18th century Japan, Homma used an approach called chart patterns as part of his trading style that laid the groundwork for modern technical analysis.
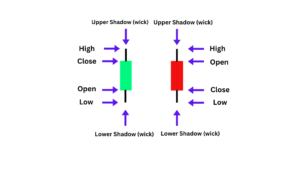
From Rice to Riches Homma made headlines when he famously illustrated price movement through candlestick charts that demonstrated its opening, high, low, and closing prices in an extended time period. His remarkable ability in forecasting future prices garnered widespread acclaim and eventually led to formal candlestick analysis as an aspect of financial analysis.
Candlestick Techniques in the West
It wasn’t until the 1980s that candlestick techniques made their mark in Western society, due to the efforts of Steve Nison.
Top Candlestick patterns became part of Western finance lexicon and opened up new insights into market dynamics while helping bridge East-West differences in trading methodology.
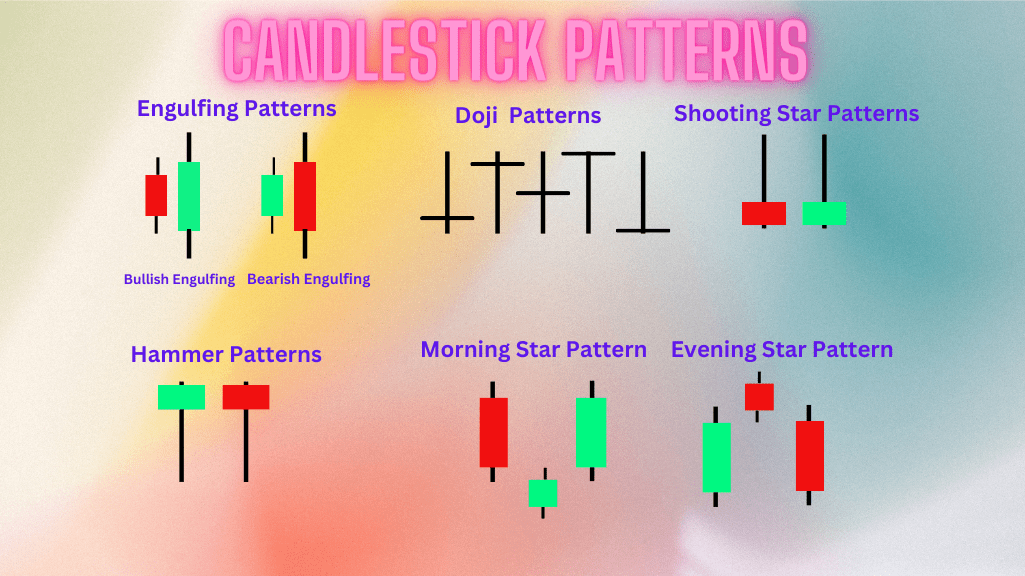
Candlestick patterns come in all forms; from single candles to complex formations composed of multiple candlesticks forming specific designs.
Here we discuss some of the more prominent and influential Top candlestick patterns traders encounter during market analysis.
Doji :
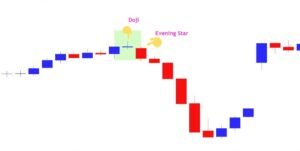
A Doji occurs when opening and closing prices of an asset are almost equal, signalling market indecision as well as possible reversals.
Bullish and Bearish Engulfing :
An engulfing pattern occurs when the body of a second candle fully engulfs that of the preceding candle, suggesting either an upward trend or an impending decline.
A bullish engulfing pattern suggests a potential rise while bearish ones could signal impending downward shift.
Hammer and Hanging Man :
Hammer and Hanging Man Both patterns share similar structure, featuring a small real body at the top of a candlestick with a long lower shadow.
A hammer typically forms after an initial decline and signifies potential upside, conversely, hanging man signals top formation as well as bearish reversals.
Shooting Star and Inverted Hammer :
Shooting Star and Inverted Hammer like their counterparts, shooting stars and inverted hammers represent potential trend reversals.
A shooting star features a small real body with long upper shadow, appearing after an uptrend, while inverted hammers indicate bearish potential at the bottom of downtrends.
Morning and Evening Stars :
Three candle patterns that often form at the end of trends.
A morning star is a bullish reversal pattern consisting of three long bearish candles, followed by any color short candle, then completed by another long bearish candle – its bearish counterpart being evening star.

Learning How to Recognize and Interpret top Candlestick Patterns :
While recognizing top candlestick patterns is easy enough, understanding their implications takes more insight.
Here is a guide on deciphering these visual cues and understanding their possible interpretations:
Single Candle Interpretation :
Start from scratch by understanding what a single candle represents, its anatomy and what it signifies such as having an upper shadow that indicates buyers drove prices higher during a session, only for sellers to bring prices down by its close.
Pattern Identification :
Recognize and label any patterns you see. Is it a Doji, Engulfing, or Hammer pattern?
Context Matters :
Patterns don’t exist in isolation. Context is key when trying to interpret them and it should include factors like previous trends leading up to them, volume levels and possible support/resistance levels when trying to assess significance of patterns.
The Significance of Candlestick Patterns in Technical Analysis :
Technical analysis involves studying market action through charts in order to forecast future price movements.
Top Candlestick patterns form an integral part of this methodology and provide traders with invaluable data which they can use to forecast market movements.
Trend Identification :
Top Candlestick patterns can provide a visual aid in recognizing trends and their reversals. Trend lines on candlestick charts show market sentiment clearly, helping traders distinguish between bullish and bearish periods of the market.
Support and Resistance Levels :
Certain Top candlestick patterns, like the Doji, can signal when an asset has reached or near key support or resistance levels that represent critical decision points for traders.
Volume Confirmation :
Traders often look for volume spikes to validate top candlestick patterns and potentially boost their predictive abilities. Patterns accompanied by higher volumes are considered more accurate and could prove even more powerful as predictors.
Practical Examples and Case Studies of Candlestick Patterns in Action :
Theory can become tangible through application. Imagine hypothetical or actual scenarios in which top candlestick patterns were instrumental in developing successful trade strategies or anticipating significant market moves.
Case Study: 2008 Financial Crisis :
Top Candlestick patterns played an instrumental role in foretelling the 2008 Financial Crisis.
Particularly prevalent patterns included Bearish Engulfing and Doji formations which signalled mounting selling pressure and market uncertainty as the crisis progressed.
Case Study: Corona Crisis in 2020 :
The Corona Crisis of 2020 stood out as a profound period in global financial markets, marked by extreme volatility and unpredictability.
Top Candlestick patterns during this period offered investors invaluable insight into market sentiment as they considered the pandemic and its economic repercussions.
Notably, the market’s initial steep decline was highlighted by Bearish Engulfing patterns indicating worldwide selling pressure and widespread panic.
As governments and central banks worldwide implemented unprecedented fiscal and monetary policies to stabilize markets, Bullish Engulfing patterns emerged, heralding an upward shift in sentiment as well as the prospect of recovery.
Hammer patterns at the bottom of the market revealed strong buying interest at lower price levels, suggesting a shift from bearish to bullish sentiment.
Candlestick analysis illuminated this transition and proved its usefulness for managing such turbulent periods.
Real-Life Trades :
Highlight specific trades where top candlestick patterns were the primary indicator or confirmator for make or sell decisions, for instance a Morning Star formation might have signalled an opportunity to enter long positions during an uptrend reversal.
Tips for Incorporating Candlestick Patterns into Trading Strategies :
Understanding and Implementing Candlestick Patterns into Trading Strategies
Utilizing top candlestick patterns can help increase the effectiveness of any trading strategy. Here are some strategies for incorporating them into your approach:
Combine with Other Indicators :
Its Candlestick patterns should be combined with other technical analysis tools, such as moving averages and relative strength indexes, in order to increase accuracy while decreasing false alarms.
Time Frame Consideration :
Different time frames create patterns with differing degrees of reliability. Keep this in mind when trading and match appropriate candlestick patterns with each timeframe you trade on.
Practice and Patience :
Acquiring proficiency at recognizing and interpreting candlestick patterns requires practice. Begin with a demo trading account or paper trading to hone your abilities.
Tools and Resources for Deeper Study on Candlestick Patterns :
Tools and Resources for Deeper Study on Candlestick Patterns Candlestick patterns cover an expansive realm, so any way you can expand your knowledge through charting software, books or online courses is invaluable. Here are a few tools and resources to assist in this regard.
Charting Software :
Utilize charting software that not only displays candlestick patterns but also has tools for customizing alerts and pattern recognition.
Online Communities and Seminars :
Join trading forums, webinars, and communities where practitioners discuss and share their experiences using candlestick patterns.
Conclusion :
Candlestick patterns are more than mere visual icons on a chart; they represent the heartbeat of the market, each nuanced twist and turn telling us either triumph or woe for traders who heed them.
Mastery of these patterns cannot be overstated when it comes to day trading or long-term investing, their value cannot be overemphasized.
Now is the time to illuminate your trading strategy with candlestick wisdom, leading your portfolio in newer, brighter directions.
Candlestick patterns offer powerful visual tools that can help chart, analyze and test strategies more deeply. Now is the time for harnessing their potentials.
Frequently Asked Questions (FAQs).
Q1: Are candlestick patterns effective across all markets?
Answer :
Candlestick patterns have proven their worth across many markets including stocks, forex, commodities and cryptocurrencies, however the context and market conditions must be taken into consideration to accurately interpret them.
Q2: How long does it take to become proficient at candlestick patterns?
Answer :
The time it takes can depend on individual effort, practice and experience; generally a few months of consistent study and application should help create an in-depth knowledge base for top candlesticks patterns.
Q3: Can candlestick patterns be applied to both short-term and long-term trading strategies?
Answer :
Candlestick patterns are extremely flexible, and can be applied to both short-term and long-term trading strategies with ease. The key is understanding their context in which they form.
Q4: Do I require special software to analyze candlestick patterns?
Answer :
While specialized charting software offers more powerful analysis features like pattern recognition, simple candlestick patterns can often be analyzed using free or widely available charting tools.
Q5: Are Candlestick Patterns Reliable at Predicting Market Movements?
Answer :
Candlestick patterns may provide insight into potential market movements; however, they cannot predict them 100% accurately. Therefore, other forms of analysis like technical indicators and fundamental analysis are recommended to increase their reliability.
