Introduction to the Hammer Candlestick Pattern : Best Guide
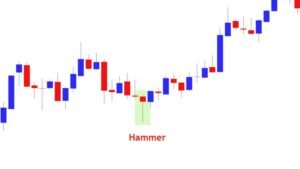
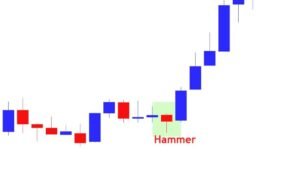
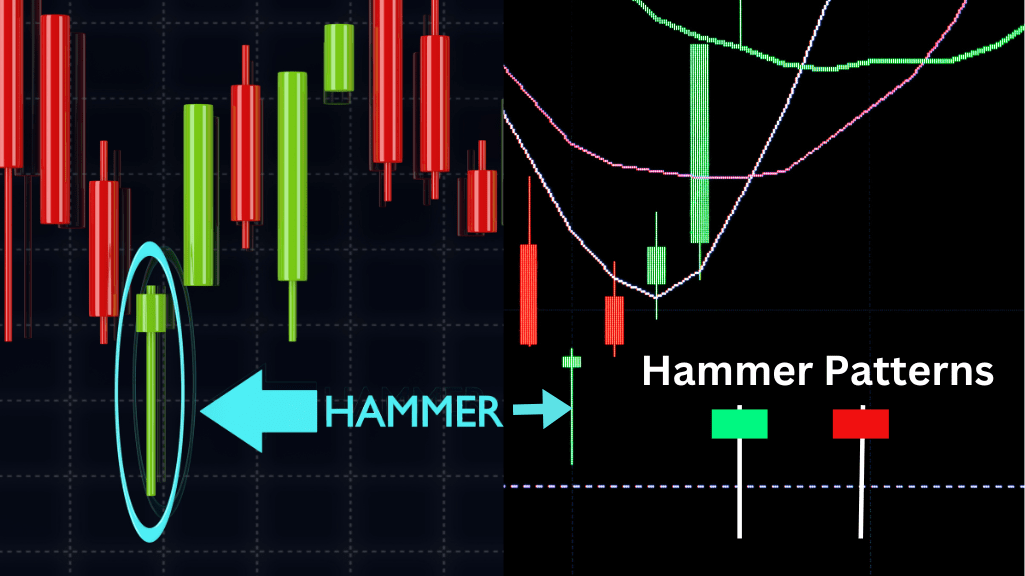
A Hammer Candlestick pattern can often be found at the bottom of a downtrend. This one candle formation features a small body near the upper end of trading range with an extended lower shadow that is at least twice its body.
- In the fast-moving world of stock markets and forex trading, understanding patterns that indicate potential price movements is like reading the market’s mind.
- One such powerful indicator of market sentiment is the Hammer Candlestick pattern those who master its interpretation have often found themselves on the successful side of lucrative trades.
- Such a formation indicates that price has tested significant support levels but rallied to close near its opening price for at least some period of time.
- The Hammer is an effective trading signal that indicates potential bullish reversal, however its interpretation must take place within its context and in conjunction with other forms of technical analysis to validate potential trend changes.
History and Origin of the Hammer Candlestick Pattern :
- Candlestick charting was introduced into Western financial markets by Steve Nison’s book on “Japanese Candlestick Charting Techniques.”
- However, its roots lie in 18th century Japan where land’s shop rice traders employed this technique to analyze trading patterns of rice trading often using it to predict future market movements.
- Through price action analysis and prediction techniques like forecasting future price action patterns like the Hammer candlestick which represents bulls trying to take back control from bears.
Understanding the Hammer Candlestick: Its Structure and Significance
In order to effectively utilize a Hammer Candlestick Pattern, it’s vitally important that its components are understood.
- Body : The real body of a candle represents its opening and closing prices; for example, a bullish (usually green or white) candle indicates that closing price was higher than opening price.
- Upper Shadow or Wick : This line extends from the top of the body down towards its highest price.
- Lower Shadow : The lower shadow extends from the bottom of your body up to its lowest price point.
A hammer’s significance lies in its long lower shadow, signalling that sellers had driven prices down substantially before buyers came in to support it back up again, signifying bullish strength.
Furthermore, its position matters: at the bottom of a downtrend it has added significance as a reversal signal.

How to Recognize a Hammer Candlestick on Stock and Forex Charts :
Recognizing a Hammer Candlestick is relatively straightforward on charts:
- Locate candlesticks that have small bodies near the day’s high price.
- Examine their lower shadow, which should extend at least twice further down than their body.
- Lastly, any preceding trend must be downward.
When all these conditions come together, there’s a good chance you have identified a Hammer candlestick pattern.
Interpreting the Hammer Candlestick: Bullish Reversal Signal
- A Hammer Candlestick can be seen as a bullish reversal signal when its sellers lose strength while buyers gain more influence in a downtrend, often appearing near its conclusion and suggesting a support level has been reached, prompting buyers to enter and push up prices upwards.
- Once a Hammer pattern has been identified, one should wait for confirmation from the following candle whether in terms of higher closes or gap-up openings on subsequent trading days in order to determine its strength as potential evidence for reversals.
- Once confirmation has been achieved, traders might open long positions, placing stop-loss orders just below the low of the Hammer candle, with take profit at resistance levels further along.
Practical Applications of the Hammer Candlestick Pattern in Trading Strategies :
The Hammer Candlestick pattern can be utilized as part of multiple trading strategies to improve decision-making processes. Examples include:
- Pure Hammer Strategy : Be on the lookout for pure Hammer formations without large bodies, upper shadows or any prior downtrend.
- moving averages : By pairing Hammers with moving averages you can verify a potential trend reversal.
- Price Action Strategies : Apply price action techniques like trend line analysis to spot areas on a chart where an unexpected Hammer Reversal could occur.
- Volatility-Based Strategies : Adjust your stop-loss and take-profit orders depending on market volatility in order to ensure successful trades using the Hammer Candlestick pattern.
Case Studies and Real-Life Examples of Successful Transactions Employing This Candlestick Method :
Real-world examples provide the clearest demonstration of the Hammer Candlestick pattern in action.
- A stock that has been on a long downtrend when an impressive Hammer forms at a key support level, after such formation occurs the next day the stock opens higher and closes even stronger, signalling its turnaround traders who entered long positions based on this signal may have experienced substantial gains as a result of such successful trade entry signals.
- An unsuccessful hammer pattern forming at minor support levels might not lead to significant price reversal, thus the importance of identifying key levels and understanding their overall market context for successful implementation is vital.
Limitations and Risks of Relying Solely on the Hammer Candlestick :
- Pattern It is crucial to be aware of any technical pattern’s limitations. When used alone, such as with the Hammer Candlestick Pattern, its limitations must be recognized, its purpose should only be used as part of an integrated analysis strategy, not as an automatic fail safe signal.
- Economic news, market sentiment analysis, or wider trends may overpower its power as a standalone indicator.
- At risk is misidentification, an inaccurate lower shadow could arise due to flash crash or low liquidity trading conditions, thus confirming reception with pending order execution can help avoid this misstep. Below Are Steps For Incorporating.

The Hammer Candlestick Into Your Trading Plan :
To use the Hammer Candlestick successfully in your trading plan, consider these tips.
- Combine indicators : Combine it with other candlestick patterns, chart patterns and technical indicators in order to increase its chance of correct interpretation.
- Practice Risk Management : Always enter the market prepared with an established risk management plan that includes stop-loss orders and position sizing based on your account size and risk tolerance.
- Be patient : Wait for strong confirmation after recognizing a Hammer pattern before acting, such as price closing or opening above its highs.
- Gain from experience : Keep track of your trades to gain valuable insight into how these Hammer patterns worked out under various conditions and continually expand your trading knowledge.
Conclusion :
- The Hammer Candlestick pattern can be an invaluable asset to traders seeking to capitalize on market reversals.
- By studying it closely and including it into your trading strategy, your odds of making successful trades significantly increase.
- The Hammer should form part of your technical analysis toolkit, but remember to trade within your means and understand market context before refining your approach over time. Like any strategy, use with caution; with an effective mindset and approach the Hammer Candlestick can become a lifesaver.

Frequently Asked Questions :
What Does the Hammer Candlestick Reveal About Market Sentiment?
Answer :
- A Hammer Candlestick can indicate an impending shift in market sentiment when selling pressure is overcome by buying pressure, signalling an upward turn after a period of declining prices.
How Important Is the Color of a Hammer Candlestick?
Answer :
- While the color of a Hammer Candlestick (such as green for bullish moves or red for bearish ones) can provide additional insight, its primary indicator – an imminent bullish reversal signal – remains more significant regardless of its hue.
Can the Hammer Candlestick be Used on All Time Frames?
Answer :
- Absolutely, the Hammer Candlestick can be identified and utilized across various time frames from 1-minute charts up to daily and weekly charts that support different trading strategies.
What are the main differences between a Hammer and Inverted Hammer Candlesticks?
Answer :
- The main distinction lies in their position within a trend; Hammer Candlesticks appear near the bottom of downtrends to signal bullish reversals while Inverted Hammers may appear near the top of up trends to signal bearish ones.
How can I tell between an authentic Hammer pattern and its counterfeit signal?
Answer :
- To identify an authentic Hammer Reversal signal, look for confirmation in the form of subsequent candlesticks that close higher than the Hammer’s closing price. Furthermore, employing other technical analysis tools can further support its validity as an reversal signal.


