The Bearish Flag Pattern: A Complete Guide for Traders
Financial markets can be unpredictable places. To navigate their way safely and make informed decisions, traders rely on reliable patterns and indicators such as technical analysts’ attention getting bearish flag pattern to anticipate price movements and make sound decisions.
We will explore this fascinating pattern through its characteristics, identification methods, trading strategies.
Understanding the Bearish Flag Pattern :
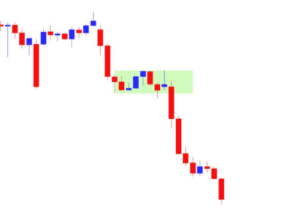
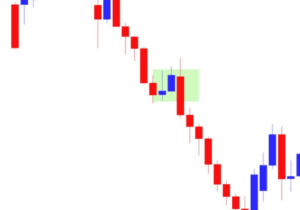
A bearish flag pattern is a continuation pattern seen on price charts that typically follows significant downward price movements.
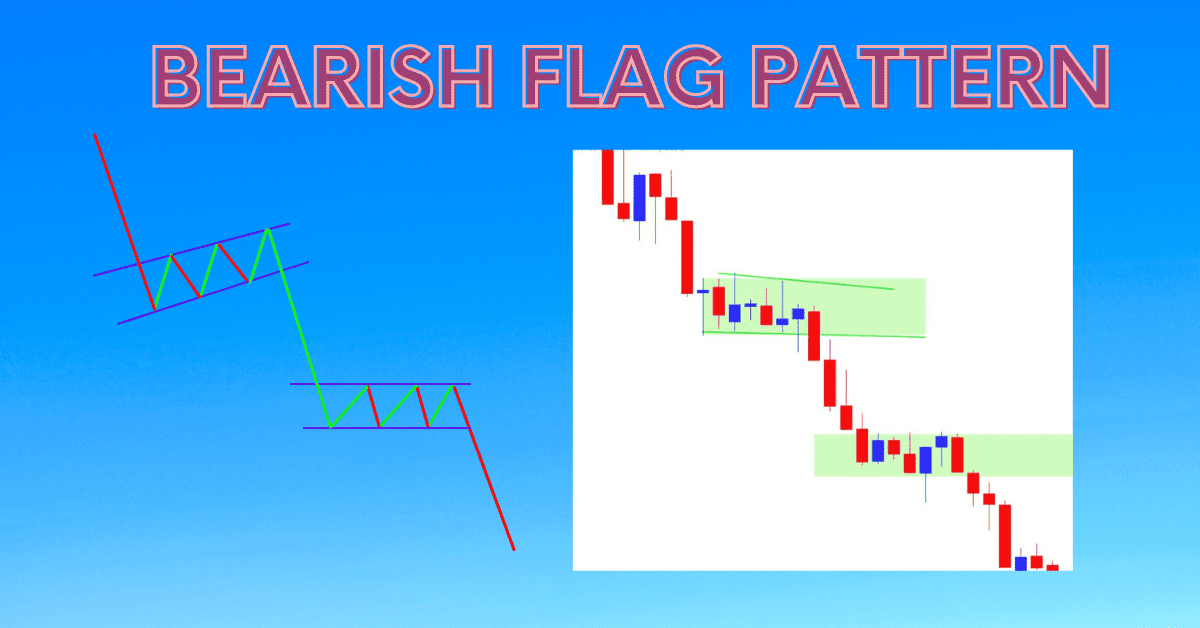
It is distinguished by a sharp decline (flagpole), followed by an extended period of consolidation (flag), with this phase acting as a temporary break before prices resume their downward path again.
These characteristics of the bearish flag pattern provide insight into its formation.
Key Characteristics of the Bearish Flag Pattern :
Recognizing a bearish flag pattern requires an acute awareness of certain key characteristics:
- Flagpole : An initial sharp decline in price often accompanied by high trading volume.
- Flag Formation : A period of consolidation marked by lower trading volume that forms an upward-sloping channel.
- Duration : The flag formation typically lasts several days to several weeks before its breakout, once confirmed, this pattern indicates continued downtrend momentum.

Identifying Bearish Flag Patterns on Price Charts :
Technical analysts utilize various tools and techniques to identify bearish flag patterns on price charts. These include:
- Visual Inspection : Manually scanning price charts to detect patterns that resemble those associated with bearish flags
- Drawing Tools : Utilizing charting software to draw trend lines and channels that outline a flagpole and flag formation.
- Indicator Confirmation : Utilizing technical indicators like moving averages, relative strength index (RSI), and volume to verify validity of pattern. Trading Strategies for Bearish Flag Patterns.
Trading the bearish flag pattern requires developing an effective plan in order to capitalize on potential downside opportunities.
Some common strategies for doing so may include :
- Short Selling : When prices break below the lower boundary of a flag formation, initiate short positions with a stop loss above recent swing high.
- Profit Targets : Establishing profit targets based on flagpole height or using Fibonacci Retracement levels as potential price targets.
- Risk Management : Implementing stringent risk management principles to limit losses caused by adverse price movements.
Mastering the bearish flag pattern requires an intricate mix of technical analysis skills, risk management practices and educational resources that enable traders to enhance their trading strategies and capitalize on potential profit opportunities in financial markets.
Demystifying the Bearish Flag Pattern for Beginners :
This section seeks to demystify the bearish flag pattern for beginners by offering an introduction into what this pattern entails, its significance in technical analysis, and why understanding it is crucial for traders.
Deconstructing the Anatomy of a Bearish Flag :
Here, we dissect each component of a bearish flag pattern in order to gain a deeper insight into its structure.
This includes dissecting flagpole and formation elements and their respective roles within this pattern as well as how they contribute towards its overall formation.
Key Characteristics of the Bearish Flag Pattern :
This section examines the distinguishing traits that define bearish flag patterns as unique chart formations, such as duration, slope angle, volume and confirmation criteria providing traders with clear guidelines to quickly recognize authentic bearish flag patterns.

Recognizing a bearish flag pattern requires having a keen eye and looking out for specific characteristics:
- Flagpole: Initial sharp decline in price often accompanied by high trading volume.
- Flag Formation: A period of consolidation marked by lower trading volume, typically creating a downward-sloping channel.
- Duration: The typical flag formation typically lasts several days to several weeks before its resolution.
- Breakout: When price breaks below the lower boundary of a flag formation, signaling further downward momentum, the pattern is confirmed as bearish flag patterns on price charts can be identified and confirmed as confirmation signals for more bearish trading action.
Identifying Bearish Flag Patterns on Price Charts :
This section examines practical techniques for recognizing bearish flag patterns in real-time market environments. We cover pattern recognition skills, technical analysis tools and the significance of verifying signals before making trading decisions.
Technical analysts use various tools and techniques to recognize bearish flag patterns on price charts. These methods include:
- Visual Inspection: Manually scanning price charts to look for patterns that resemble bearish flag characteristics, then making notes as needed.
- Drawing Tools: Utilizing charting software to draw trend lines and channels that delineate the flagpole and flag formation.
- Indicator Confirmation: Utilizing technical indicators like moving averages, relative strength index (RSI), and volume to validate and confirm the validity of a pattern.
Trading Strategies for Bearish Flag Patterns :
Here we explore proven trading strategies tailored specifically for bearish flag patterns, including entry and exit strategies, risk management techniques and profit-taking approaches designed to maximize potential gains while limiting losses.
Trading the bearish flag pattern requires developing an effective strategy in order to capitalize on any potential downside opportunities.

Some examples of such plans could include :
- Short Selling: Establishing short positions when the price drops below the lower boundary of a flag formation with an order to sell set above recent swing high.
- Profit Targets: Setting profit targets according to flagpole height or using Fibonacci Retracement levels as potential price targets.
- Risk Management: Implementing stringent risk management principles to limit any losses in case of adverse price movements.
What Is the Bearish Flag Pattern Rule :
The main rule of a bearish flag pattern is that it indicates continuation of an existing downtrend.
Usually composed of two parts :
- Flagpole: This pattern typically begins with a sharp and significant downward price movement known as the flagpole, typically accompanied by high trading volume indicating strong selling pressure in the market.
- Flag Formation: Subsequent to the flagpole is a period of consolidation known as flag formation, where prices trade within narrower ranges relative to those seen before and trading volume decreases significantly compared with what occurred prior to flagpole formation.
- Flag formation serves as a temporary stop before price resumes its downward movement again.
When the price breaks below the lower boundary of the flag formation, signaling continuation of its downtrend, traders often use this breakout as an entry or add-on signal for short positions with appropriate risk management strategies in place.
Conclusion :
Mastering the bearish flag pattern requires a combination of technical analysis skills, risk management techniques, and access to reliable educational resources.
Adopting Innovation in Financial Education This final section considers the wider repercussions of understanding bearish flag patterns, as well as their place within innovation-led financial education.
Traders are encouraged to embrace cutting-edge technologies and methodologies that may further their knowledge and mastery of the financial markets.
By understanding its structure, characteristics, and trading strategies, traders can leverage the bearish flag pattern to identify potential trading opportunities in the financial markets.

Frequently Asked Questions :
What Is a Bearish Flag Pattern?
Answer :
- A bearish flag pattern is a technical analysis pattern observed in financial markets, typically following significant downward price movements.
- It features a sharp decline, known as the flagpole, followed by consolidation in an ascending channel referred to as the flag.
- Traders interpret bearish flag patterns as continuation patterns which signal potential for more downside momentum.
What makes the bearish flag pattern different from other chart patterns?
Answer :
- A bearish flag pattern differs from other chart formations by virtue of its distinct characteristics and implications for price action.
- Unlike reversal patterns that signal potential changes in trend direction, bearish flag patterns serve as continuation patterns by temporarily pausing price movement before returning back down trending again.
- Additionally, its structure – complete with flagpole and flag formation distinguishes it from triangles, wedges, or head and shoulders formations.
Are bearish flag patterns reliable indicators for market reversals?
Answer :
- Bearish flag patterns should not typically be taken as reliable indicators for market reversals, since they are more often considered continuation patterns rather than reversal ones.
- Instead, traders typically interpret bearish flag patterns as temporary pauses in an existing downward trend with the expectation that price will resume its descent following consolidation phases.
- It should be remembered however, that no trading pattern or indicator can guarantee results, so traders should exercise extreme caution and utilize additional technical analysis tools and risk management strategies when trading bearish flag patterns.
Can Beginners Effectively Trade Bearish Flag Patterns?
Answer :
- While beginners can successfully identify and trade bearish flag patterns, it is crucial for them to approach trading with caution and an understanding of technical analysis principles.
- They should familiarize themselves with its characteristics – including structure, duration and confirmation criteria – before practicing on demo accounts until their experience grows sufficiently to enable real market situations where bearish flag patterns can be traded successfully.
- By practicing with demo accounts beforehand and gradually increasing experience when trading live markets can help beginners build confidence while honing trading strategies when dealing with bearish flag patterns successfully!
What Is the Bearish Flag Pattern Rule?
Answer :
- The bearish flag pattern’s primary rule is to signify continuation of a downtrend, typically consisting of two main components.
- These components include sharp and significant price movements known as flagpole, followed by periods of consolidation in a downward sloping channel known as flag formation.
- Flag Formation followed by price breaking below its lower boundary signalling continuation of downtrend used by traders as an opportunity to enter short positions or add to existing short positions while employing appropriate risk management strategies.


