The Bearish Symmetrical Triangle Pattern: Ultimate Guide for Traders
Introduction :
- The Bearish Symmetrical Triangle Pattern Strategies for Crypto, Forex, and Stocks.
- To improve your trade, learn to interpret the signals, use technical analysis, and make use of actual cases.
- Technical analysis-wise, patterns are quite important for traders in predicting future price changes.
- Among these trends, the Bearish Symmetrical Triangle Pattern is particularly noteworthy for its dependability and regular occurrence across stocks, currency, and cryptocurrencies among other markets.
- This trend is especially important since it usually indicates that a downtrend will continue and offers traders important information for their trading plans.
Understanding the Formation of the Pattern :
Converging Trend lines :
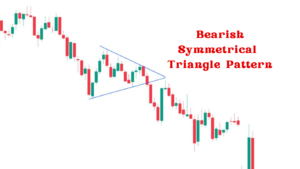
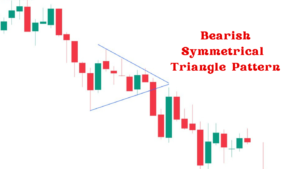
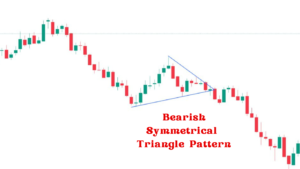
- Two converging trend lines creating a symmetrical triangle define the Bearish Symmetrical Triangle Pattern.
- These trend lines cross each other to show a phase of consolidation in which the price movement gets ever more confined.
- Reflecting a balance between buyers and sellers progressively leaning in favor of the sellers, the upper trend line slopes down while the bottom trend line slopes higher.
Price Action Inside the Pattern :

- The price moves between the converging trend lines during the pattern’s creation to produce a sequence of lower highs and higher lows.
- This price activity shows the uncertainty of the market since neither bulls nor bears can rule. Since this pattern can reveal important information about future price movements, traders monitor its development very attentively.
- But as the trend moves, the range of price movement gets smaller, implying a future break-through.
- This limited range suggests that market players are growing more focused and that the balance of power between buyers and sellers is likely to change, therefore maybe causing a notable price movement once the breakout takes place.
Volume Analysis :
- Usually declining throughout the creation of the Bearish Symmetrical Triangle Pattern, volume reflects the lower market activity as it consolidates.
- This phase of declining volume suggests traders’ lack of strong conviction while they wait for a clearer path. Still, volume often surges during the breakout, verifying the validity and force of the action.
- This increase of volume points to traders’ current dedication to the new trend, either continuation or reversal.
- Therefore, tracking volume can assist traders make better selections and offer extra validation of the validity of the pattern.
- Furthermore, knowing the subtleties of volume variations might provide more profound understanding of market mood and possible future price swings.
Finding the Bearish Signals :
Breakdown Points :
- The break point of the Bearish Symmetric Triangle Pattern is the most important indicator.
- This signals a possible continuation of the down trend when the price falls below the lower trend line.
- To verify the breakout, traders should search for a decisive closing below the trend line, ideally accompanied by a volume increase.
- To help to validate the pattern, one should also take into account other technical indicators as moving averages and the Relative Strength Index (RSI).
- More confidence that the price movement is truly following the expected bearish trend will help traders in this enhanced analysis.
- Key are patience and attention since, if not closely watched, false breakouts can cause possible losses.

Pattern Volume and Pattern Duration :
- As was already noted, confirming the pattern depends much on volume. Since it suggests stronger selling pressure, a notable rise in volume during the collapse supports the possibility of a bearish continuity.
- On the other hand, little volume could point to a false breakout.
- Furthermore, the length of the pattern might provide important hints, longer patterns usually produce more significant breakouts since they indicate longer periods of consolidation and accumulation or dispersal.
- Consequently, while evaluating market trends and projecting future moves, both volume and duration are extremely important considerations.
Case Studies and Actual Examples :
Example – I : Stock Market
- Examining a historical chart of a well-known stock displaying a Bearish Symmetrical Triangle Pattern, this case study will look at Examining price activity, trend lines, and volume can help us to pinpoint the main points of the pattern and the consequent price movement.
- This sample will help traders understand possible points of entrance and departure.
Example – II : The Forex Market
- The forex market is known for its volatility, hence it’s perfect playground for pattern detection.
- We will look at a recent Bearish Symmetrical Triangle Pattern in a significant currency pair, stressing the indications supporting the pattern and the consequent market action.
Example – III :the Cryptocurrency market
- Dramatic price swings of cryptocurrencies are well known, and the Bearish Symmetric Triangle Pattern is no exception.
- Examining a chart of a well-known cryptocurrency in this case study will help us to understand how traders might have used the pattern to guide their decisions on trade.

Trading Strategies :
Entry Points :
- Usually following a verified collapse, the optimum entry point for trading the Bearish Symmetric Triangle Pattern is somewhat below the lower trend line.
- Combining waiting for a closure below the trend line with more volume helps lower the probability of false breakouts.
Stop-Loss Placement :
- In trading, risk management is absolutely critical; a stop-loss order helps to guard against unanticipated market swings.
- Placing the stop-loss immediately above the final high inside the triangle is a frequent approach for this pattern, therefore guaranteeing that the trade is closed should the price turn around direction.
Profit Targets :
- Although it can be difficult, a typical method is to project the height of the triangle downward from the breakdown point after determining profit targets.
- This will help to define This approach lets traders create reasonable profit objectives by approximating the possible price movement.
Risk Management :
- Long-term trading performance depends on good risk management.
- On any one trade, traders should make sure they do not risk more than a nominal fraction of their trading funds. Further reducing risk include diversifying trades and applying position sizing strategies.
Conclusion :
- A great weapon in a trader’s tool, the Bearish Symmetrical Triangle Pattern offers insightful analysis of possible price moves on different markets.
- Traders can profit on this pattern by knowing the formation, seeing bearish indications, and using successful trading techniques.
- Those wishing to improve their trading techniques and broaden their knowledge must always be studying and practicing.

Frequently Asked Questions :
What is a Bearish Symmetrical Triangle Pattern?
Answer :
- In technical analysis, a bearish symmetric triangle pattern is a chart pattern used to forecast the direction of a downtrend’s continuing.
- Usually coupled by declining volume, price swings produce two convergent trend lines that define the pattern.
- It points to more price falls by indicating an approaching break-through to the downside.
How may traders verify a symmetrical triangle pattern with bears?
Answer :
- Looking for a clear price break below the lower trend line will help traders confirm a Bearish Symmetrical Triangle Pattern—ideally accompanied by an increase in trading activity.
- The validation guarantees the validity of the breakthrough, therefore lowering the false signal risk.
Within the Bearish Symmetric Triangle Pattern, what function does volume serve?
Answer :
- Validating the Bearish Symmetrical Triangle Pattern depends on volume in great part.
- Usually suggesting market consolidation, volume declines during the creation of the pattern.
- But a notable increase in volume during the breakdown supports the strength of the breakout and suggests a more likelihood of a continuous decline.
With this pattern of trading, how should stop-loss orders be positioned?
Answer :
- Traders should put stop-loss orders somewhat above the triangle’s latest peak to control risk.
- This approach reduces possible losses should the trade not go as predicted and helps guard against unanticipated price reversals.
Can the Bearish Symmetrical Triangle Pattern be used in multiple markets?
Answer :
- Indeed, the Bearish Symmetrical Triangle Pattern is adaptable and may be used in stocks, Forex, and cryptocurrency among other markets.
- Its ideas remain constant, which lets traders use it as a tool for evaluating several asset classes and guiding their judgments on trade.


