The Bearish Harami Pattern: A Comprehensive Trading Guide
Stock trading involves deciphering patterns and signals that speak volumes about market forces. One such pattern that traders frequently heed is the Bearish Harami candlestick pattern.
- Although seemingly innocuous at first glance, this seemingly innocent pair of candles tells a powerful tale of potential downtrends and bearish reversals that should not be overlooked when developing trading strategies or analysis in volatile stock market environments.
- In this comprehensive guide we not only decode but also explore this pattern’s significance in helping your trading strategies or analyses and potentially guide your way through stock market volatility.
Understanding Candlestick Patterns :
- Candlestick patterns are visual representations of price movements over specified time frames, often used in technical analysis. Each pattern is created by the shape and position of candlesticks that traders believe can indicate whether a stock or index will rise or fall.
- Candlestick patterns are popular among traders for many reasons. Their easy interpretation offers a clear visual of market sentiment.
- Furthermore, their application spans multiple markets and time frames from intraday trading to long-term investing often serving as leading or confirming indicators for future price action, helping traders make informed trading decisions.
Overview of the Bearish Harami Pattern :
- The Bearish Harami candlestick pattern is a moderately reliable trend reversal indicator composed of two candlesticks.
- It typically appears during an uptrend and suggests potential bearish reversals; its name comes from Japanese word for pregnant woman as its appearance may hint at significant market moves in its path.
When and Where Does the Bearish Harami Appears :
- The Bearish Harami can often be found at the conclusion of bullish runs and is particularly reliable when seen near areas of resistance.
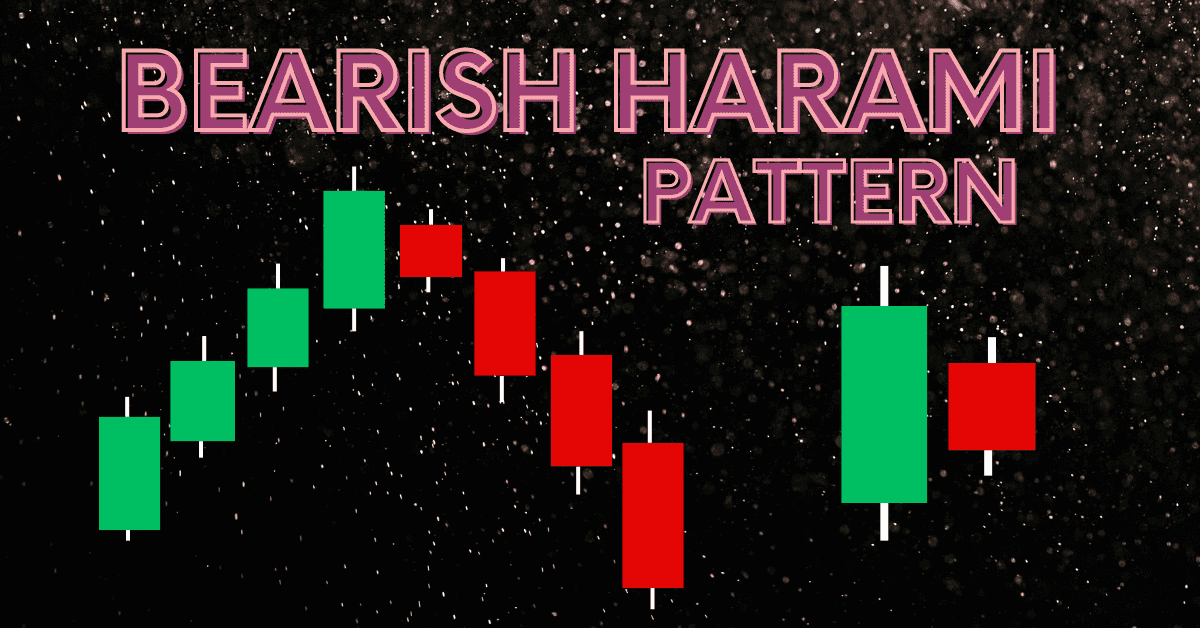
- It is distinguished by two consecutive large bullish candles followed by one or more smaller bearish candles completely engulfing it, generally speaking, the smaller second candle makes this pattern more impactful.

Breakdown of Bearish Harami Components :
To properly recognize and interpret a Bearish Harami, one must understand its two constituent candles’ anatomies.
The First Candle in a Bearish Harami: Bullish Momentum :
- The initial candle of a Bearish Harami pattern is typically long and bullish, signalling an upward trend with many trades taking place simultaneously. This initial bullish candle often represents strong buying momentum.
The Second Candle in a Bearish interruption :
- The second candle in a Bearish Harami is bearish and small, containing both opening and closing prices within its body this indicates a decrease in buying pressure and an increased potential for down trending.
Real-World Examples of Bearish Harami in Stock Charts :
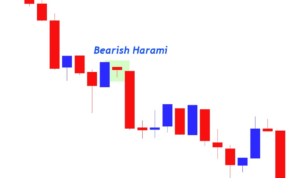
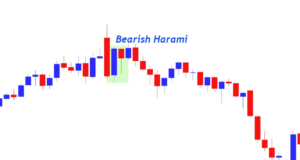
- To illustrate this concept more vividly, let’s look at real-world stock charts where Bearish Harami has made its mark. Here is one before and one after drop both examples showing strong evidence of Bearish Harami formation.
- Imagine a stock chart showing an obvious uptrend multiple consecutive days with rising prices and strong bullish momentum.
How Bearish Harami Emerges :
- Mid-trend, the Bearish Harami pattern emerges, characterized by a small bearish candle which is completely enveloped by an earlier bullish candle. for further analysis of Bearish Harami patterns.
- After the pattern appears, its effects become evident as its price action transitions from bullish to bearish.
Significance and Interpretation of the Bearish Harami Pattern :
- The Bearish Harami is an influential pattern due to what it symbolizes, an end of an upward trend and likely beginning of a bear market if part of an extended pattern with lower highs and lower lows.

What the Pattern Indicates :
- A Bearish Harami occurs after an extended uptrend and signifies a decrease in buying pressure as bulls lose control and bears step in often heralding a potential price reversal.
Bearish Harami within a Broader Context :
- Candlestick patterns should never be read alone candlestick patterns like Bearish Harami should prompt you to look for confirmation through other technical indicators, like moving averages or volume trends.
Strategies for Incorporating Bearish Harami into Trading :
Recognizing a Bearish Harami is only part of its value; learning how to incorporate it into your trading strategy is what will unlock its full potential.
Utilizing the Bearish Harami as a Signal :
- Some traders employ the Bearish Harami pattern as an effective sell signal, particularly when it occurs near key resistance levels or forms at or near significant resistance points. Used alongside other bearish indicators, it can provide powerful evidence against shorting stocks.
Setting Stops and Targets :
- A second strategy is to use recent highs as stop-loss levels and set profit targets near former support levels this approach limits losses while potentially capturing much of a bearish move.
Incorporating News and Events :
- As part of your strategy, it’s also crucial to stay aware of upcoming news events or market catalysts which might alter the significance of your pattern.
Summary of Key Points :
- The Bearish Harami pattern represents an essential shift in market sentiment. By studying its formation, understanding its effects, and building trading strategies around it, investors can gain an edge in today’s volatile stock market trading arena.
- Candlestick patterns such as the Bearish Harami may not provide absolute certainty when making trading decisions, they provide additional insight that may bolster them, though their true effectiveness lies when used alongside other forms of analysis and trading tools.

Take Steps for Further Exploration :
- To deepen your understanding of the Bearish Harami pattern, explore historical case studies or back test scenarios before enrolling in a candlestick pattern analysis course. With practice comes better trading skills that enable more informed investment decisions.
- At all times, keep in mind the markets are inherently complex and constantly shifting, and mastery lies not solely with understanding one pattern or indicator, but in understanding a wide array of indicators which, when correctly interpreted, provide clarity into what may come next in trading.
- The Bearish Harami pattern should only ever be seen as one tool in your arsenal of trading tools.

Frequently Asked Question :
How accurate is Bearish Harami ?
Answer :
- Bearish Harami patterns serve as early warning signals of reversals in bullish trends.
- A Bearish Harami occurs when two candlesticks follow each other within range and close, creating an early indicator of impending change.
- Bearish Harami patterns indicate a potential change in momentum and potential bearish movement, however, their accuracy like that of all technical analysis tools cannot be guaranteed.
- Combining other indicators, such as volume analysis or candlestick patterns, to confirm reversal signals is more reliable.
- Bearish Harami patterns should only be employed as part of an overall trading strategy in order to maximize their efficacy. They are best utilized after extended uptrends such as after an upward spiral.
- As a result, while they can serve as useful tools in identifying potential reversals, traders should employ them within an all-encompassing approach in order to optimize its efficacy.
What is the entry point of a Bearish Harami Pattern?
Answer :
- Usually after it has completely formed, an entry point for trading based on this pattern marks its possible beginning and could signal the start of an uptrend or downtrend.
- Traders typically look for additional confirmation after seeing a Bearish Harami to lower risk and ensure reliability of this signal.
- Such confirmation might take the form of a third candlestick that closes lower than its predecessor, further suggesting bearish momentum.
- Or traders could look for declining volumes or other technical indicators that indicate a potential reversal scenario as confirmations for entering trades based on Bearish Harami reversals signals, allowing traders to capitalize on early bearish trends.
What is the main sign of a Bearish Harami Pattern in stock trading?
Answer :
- The Bearish Harami pattern signifies an impending market reversal where momentum may shift from bullish to bearish, suggesting that any uptrend may soon lose steam and downtrend may soon follow.
How Reliable Is the Bearish Harami as a Trading Signal?
Answer :
- While the Bearish Harami can serve as an effective indicator of market reversals, its reliability increases when used alongside other technical analysis tools and indicators. When making trading decisions, one should not rely just on it.
Does the Bearish Harami Pattern Exist Outside of Stock Markets?
Answer :
- Yes, the Bearish Harami pattern can appear across any financial market that uses candlestick charts such as forex, commodities or cryptocurrency markets – with its interpretation remaining consistent across each one.
What should traders do upon identifying a Bearish Harami pattern?
Answer :
- Traders should seek additional technical indicators or patterns as confirmation before making a trade decision. It is also wise to take into account market context and any upcoming economic events that might alter its significance.
Does the Bearish Harami Pattern Apply in All Time Frames?
Answer :
- Yes, the Bearish Harami pattern can be recognized across various time frames, from minutes or hours charts up to longer-term ones like days, weeks, or months; though recognizing patterns observed on longer time frames may provide greater insights into broader market shifts.


