The Bearish Expanding Triangle Pattern : A Complete Guide for Traders
Introduction :
- Understanding and identifying chart patterns can help you to improve your capacity to make wise selections in the ever-changing field of trading.
- Among the useful tools in a trader’s technical analysis toolkit is the Bearish Expanding Triangle Pattern.
- This article will walk you through the nuances of this pattern and offer ideas and techniques to enable you to profit from it in several markets.
- Trade the Bearish Expanding Triangle pattern in forex, stocks, and cryptocurrencies markets.
- To optimize your gains, find actual cases, trading techniques, and risk-reducing advice.
Understanding the Geometry and Structure of the Pattern :
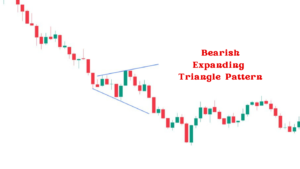
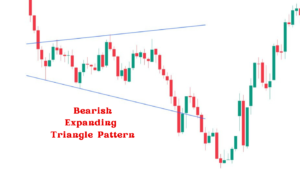
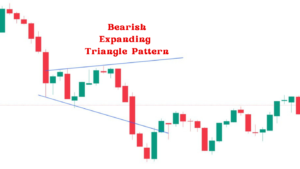
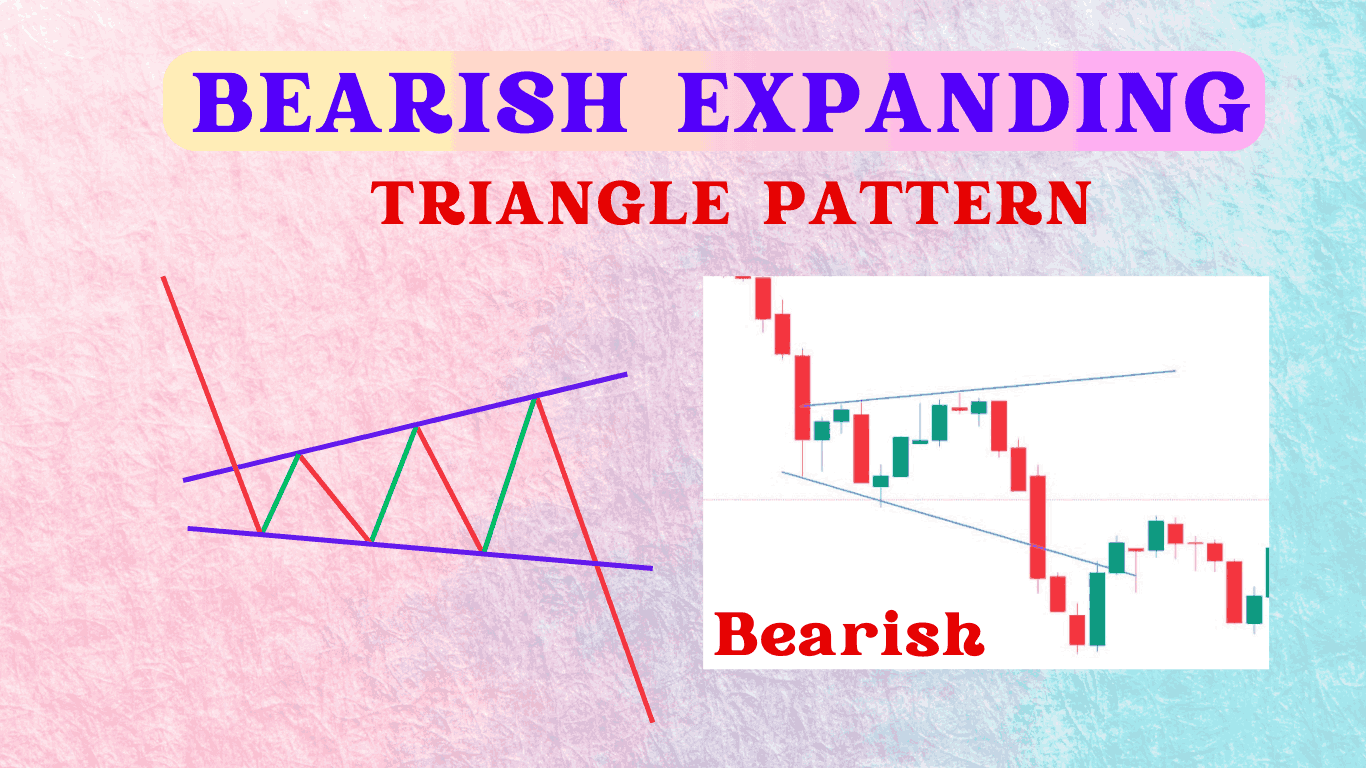
- Two divergent trend lines creating a spreading structure define the Bearish Expanding Triangle, sometimes referred to as the expanding triangle.
- Usually found in financial markets, this pattern is a technical analysis chart development.
- The widening expanding triangle indicates growing volatility and unpredictability unlike a conventional triangle pattern that narrows over time.
- The different trend lines imply that market players are growing more doubtful about future price changes, which causes more price volatility.
- Given that this trend may presage notable market reversals or ongoing turbulence, traders should use care.
- Knowing the subtleties of this pattern could help one get important understanding for wise trading judgments.
Key Characteristics :

Higher Highs and Lower Lows :
- The pattern comprises of higher highs and lower lows, therefore forming an expanding form like to a megaphone.
- This suggests growing volatility as traders drive prices to both new extremes in both directions.
Volume Increase :
- Usually, volume rises as the pattern unfolds to indicate more market activity and interest.
- Usually reflecting traders’ increasing uncertainty or conjecture, this increase in volume helps to create the pattern.
Breakout :
- A bearish trend is indicated when the price falls below the lower trend line, therefore verifying the pattern.
- This breakout implies that sellers have acquired control, therefore driving prices down with more vigor.
- Before making strategic judgments, traders typically seek for this validation.
Real Time Examples in Stock, Cryptocurrency, and Forex Markets :
Stock Market Example :
- Over three months, Company X presented a beautiful Bearish Expanding Triangle Pattern.
- Higher highs and lower lows starting the pattern produced a broadening structure.
- At $50 and $60 respectively, key support and resistance levels were found.
- The stock finally dropped significantly and presented a great chance for short-sellers when it fell below the $50 support level.
Cryptocurrency Market Example :
- During a Bearish trend, Bitcoin had an evident Bearish expanding Triangle pattern .
- Over many weeks, the pattern developed with rising trade volume and volatility.
- The breach below the $30,000 support level produced a quick drop to $25,000, therefore confirming the predictive power of the pattern.
Forex Market Example :
- Over six weeks the EUR/USD pair showed a Bearish Expanding Triangle Pattern .
- Support at 1.20 and resistance at 1.25 defined the development as having more highs and less lows.
- The pair sank to 1.15 after falling below the 1.20 support, providing forex traders with unambiguous indication of a bearish trend.

Finding Main Levels of Support and Resistance in the Pattern :
- Effective trading depends on the Bearish Expanding Triangle Pattern support and resistance levels being known.
- By helping traders decide entrance and departure locations, these levels maximize earnings and reduce losses.
- Knowing these fundamental levels helps traders negotiate the complexity of the market and make more wise selections.
Steps to Identify Support and Resistance :
Draw Trend lines :
- To create the expanding trend lines, first locate the higher highs and lower lows.
- Analyze the price action over a period of time carefully to make sure the trend lines fairly depict the movements of the market.
Analyze Volume :
- As the pattern develops pay particular attention to the volume.
- Look for growing volume; this can confirm the trend and usually indicates more robust market interest.
- Usually, a higher volume during triangle formation suggests that a notable price change is about to happen.
Verify Breakout Points :
- Verify the breakout under the lower trend line for a bearish indication once the pattern is developed.
- This confirmation is quite vital as it aids to prevent erroneous breakouts that could influence bad trading choices.
- Seeking to profit from the expected direction of the market, traders might locate ideal entrance or exit points near the breakout point.
- Following these guidelines carefully will help traders improve their capacity to recognize and act upon support and resistance levels inside the Bearish Expanding Triangle Pattern, so producing more strategic and maybe lucrative trades.
Bearish Expanding Triangle Pattern Trading Strategies :

Breakout Strategy :
- Before launching a short position, traders sometimes wait for a verified breakdown below the lower trend line.
- Under this approach, one sets a sell order just below the support level and a stop-loss order above the recent high.
Trend Following Strategy :
- A further useful trend-following signal is the Bearish Expanding Triangle Pattern.
- After the breakthrough, traders can create short positions riding the bearish trend until indications of reversal show.
Momentum Strategy :
- The higher volatility inside the pattern allows momentum traders to profit.
- Analyzing volume and momentum indicators helps traders find ideal points of entrance to maximize temporary profits.
Setting Appropriate Stop-Loss and Take-Profit Levels and Risk Management :
- Trading the Bearish Expanding Triangle Pattern calls for good risk control.
- Correct stop-loss and take-profit levels guarantees that possible losses are reduced and profits are guaranteed.
Risk Management Tips :
- Stop-Loss Orders :
- Stop-loss orders should be placed above the current high to control losses.
Take-Profit Orders :
- Set take-profit orders at either expected goal zones or crucial support levels.
Position Sizing :
- Account size and risk tolerance will guide position sizing.
Conclusion :
- A flexible and strong pattern, the Bearish Expanding Triangle Pattern can reveal insightful analysis of market developments.
- Understanding its structure, spotting important levels, and using sensible trading techniques can help traders maximize their chances to benefit from bearish trends.
- Advances in trading algorithms and AI-based analysis tools will probably help to increase pattern recognition and predictive accuracy in future trends to observe.
- Market Volatility: Constant changes in geopolitics and economy will affect market volatility, so patterns like the Bearish Expanding Triangle Pattern will remain increasingly pertinent.

Frequently Asked Questions :
What is the definition of a Bearish Expanding Triangle Pattern ?
Answer :
- Technically, a Bearish Expanding Triangle Pattern is a pattern marked by rising volatility and broader price swings, therefore producing a broadening structure.
- Usually indicating a continuance of a declining trend, it is used to forecast possible Bearish breakouts in forex, equities, and cryptocurrency among other markets.
How can I recognize a charting bearish expanding triangle Pattern ?
Answer :
- Search for higher highs and lower lows creating an expanding form to find a Bearish Expanding Triangle.
- Create triangular outlines by drawing trend lines along these highs and lows.
- As the pattern develops, note also rising trading volume, suggesting rising market volatility and interest.
What are the most important levels of support and resistance in a Bearish Expanding Triangle Pattern ?
Answer :
- The expanding triangle’s lower and upper bounds reveal important degrees of support and resistance.
- Support comes from the lower trend line, resistance comes from the upper trend line.
- These levels guide traders in deciding where to enter and leave their transactions.
How may I trade the Bearish Expanding Triangle Pattern using these techniques ?
Answer :
- The Bearish Expanding Triangle Pattern can be traded using the Momentum Strategy, Trend Following Strategy, and Breakout Strategy among several approaches.
- Depending on the breakthrough below the lower trend line, following the bearish trend, or capitalizing on more volatility, every plan calls for distinct entrance and exit positions.
What is the significance of managing risk when buying the Bearish Expanding Triangle Pattern ?
Answer :
- Trading the Bearish Expanding Triangle Pattern calls for good risk control.
- By setting appropriate stop-loss orders above current highs and take-profit orders at strategic
- support levels or forecasted goal zones, one can reduce possible losses and guarantee profits.
- Further improving risk management is changing position sizes depending on account size and risk tolerance.


