Mastering the Triple Top Pattern – A Complete Guide for Traders
Anyone engaged in trading must first understand chart patterns. Among the several patterns traders use, the triple top pattern is one of the more consistent ones that could indicate major market reversals.
- This page seeks to give a thorough guide to the triple top pattern, therefore enabling you to identify and trade with efficiency using this formation.
- Trade the triple top pattern, a fundamental technical analysis chart structure.
- Find its relevance, techniques for entry and departure, and practical cases to improve your trading ability.
Introduction :
- Generally speaking in technical analysis, a triple top pattern is a bearish reversal pattern.
- Three peaks at almost the same level indicate great opposition. This trend implies that the asset is trying to overcome this obstacle and can show a declining trend.
Understanding the Formation of Triple Top Pattern :
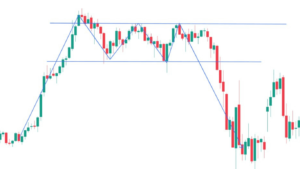
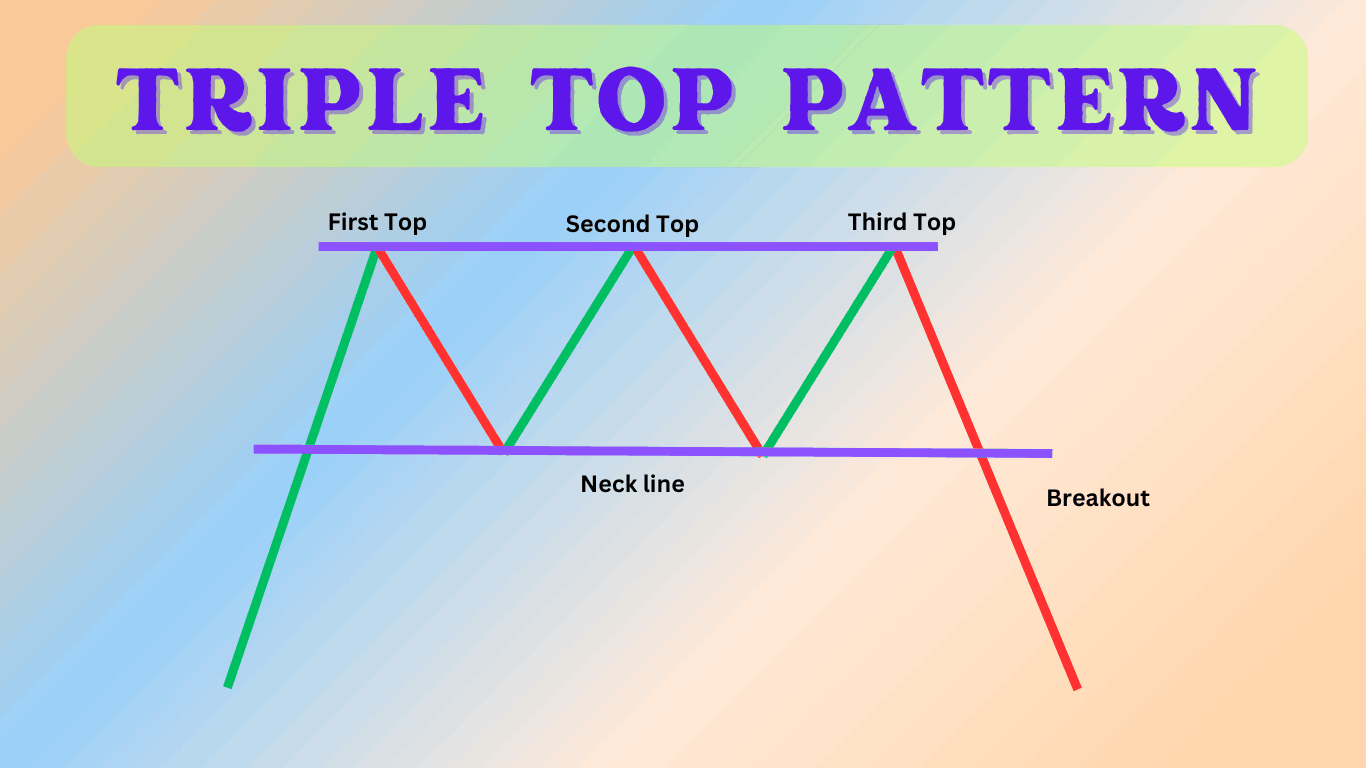
- With minor drops between the peaks, the triple top pattern results when the price of an asset reaches the same resistance level three times.
- When the price declines below the support level created by the lowest points between the peaks, the pattern is complete.

Key Characteristics :
Three Peaks :
- Every peak should be at a comparable price range to show that the asset battles to exceed this resistance level several times.
Support Line :
- Representing a level of support the price has tested and maintained before, this is the line joining the lows between the peaks.
Breakdown Confirmation :
- Usually, a notable volume increase indicates the breakdown below the support line, thereby indicating a possible change in market attitude and maybe a greater negative trend.
Importance to Technical Analysts and Stock Traders :
Technical analysts and stock traders find great use for the triple top pattern in their toolbox.
- This trend indicates a change in market attitude from optimistic to pessimistic, thereby providing chances to profit from the approaching price reversal.
- Correct identification of the triple top pattern can provide a consistent sign of notable variations in market dynamics.
Why is it important?
Predictive Power :
- Indicates that the market has tested a resistance level three times without breaking through, so helping to forecast notable price declines.
- Often this is a hint that sellers are gaining dominance while purchasers are losing power.
Risk management :
- Risk management helps to create stop-loss rules to help to reduce possible losses.
- Early recognition of the trend helps traders to tactically position their stop-loss orders just above the resistance level, therefore shielding themselves from unanticipated market swings.
By means of the triple top pattern, a trader can significantly improve his capacity to negotiate the complexity of the stock market, thereby guaranteeing better decision-making and enhanced risk management.

Identifying Triple Top Pattern in Charts :
Identifying a triple top pattern calls for meticulous study of volume and price activity. These are the thorough guidelines to spot it:
Initial Uptrend :
- Usually forming following a protracted uptrend, the first trend indicates that the asset has been showing notable increasing momentum over a long period.
Three Distinct Peaks :
- The price makes three distinct tries to breach a resistance level, each roughly reaching the same height.
- Two somewhat modest dips or pullbacks divide these peaks. The development of these peaks implies that the asset finds it difficult to climb higher.
Volume Analysis :
- Focus especially on the volume connected to each peak.
- Usually, you should see declining volume at every next high, which suggests declining purchasing pressure and less excitement among consumers.
Support Line Break :
- Once the price drops below the set support line with more volume, the pattern is verified and validated.
- This break indicates a possible reversal in the trend of the asset since it implies that selling pressure has exceeded buying pressure.
- Understanding and spotting these traits can help traders make more wise judgments and better predict possible market swings.
Best Practices in Entry/Exit Strategies and Confirmation :
Trading on the triple top pattern calls for strategic entry and exit opportunities as well as confirmation.
Traders can find possible reversal points in the price behavior of a securities by means of this ancient chart pattern.

Confirmation:
- Volume Spike :
- Look for a notable rise in volume during the breakdown.
- Strong selling pressure shown by a volume surge supports the authenticity of the breakdown and possibility for a continuous movement down.
- Technical indicators :
- Verify over bought situations using indicators such as the Relative Strength Index (RSI).
- Should the RSI exhibit overbought levels, the price is probably going to reverse.
- Further validation can come from additional signals including bollinger bands or moving average convergence divergence (MACD).
Entry Strategy:
- Breakdown Point :
- Enter a short position with verifying volume once the support line breaks.
- This suggests a possible reversal in trend since the price has dropped below the support level tested three times.
- Ensuring that the breakdown is followed by higher volume helps to confirm the movement.
Exit Strategy :
- Target Price :
- Set your aim by subtracting the measured distance from the support line to the peaks from the breakdown point.
- Based on the height of the triple top pattern, this yields a projected price goal that offers a logical basis for your exit point.
- Stop-Loss :
- To control risk, put a stop-loss order above the last peak.
- This helps guard your position should the price abruptly turn around and climb back above past highs.
- Setting a stop-loss helps you more precisely control your risk and reduce possible losses.
Including these techniques into your trading plan will enable you to profit from possible market reversals and properly trade the triple top pattern.
To back up your trading decisions, always take extra consideration on applying risk management strategies and extra investigation.

Benefits and Restrictions of Triple Top Pattern :
Advantages:
- Reliability :
- Many traders rely on this instrument since it shows great success in reversing prediction.
- Its capacity to study past data and spot important trends helps to explain this dependability.
- Clear Signals :
- Offers traders different places of entry and exit, thereby enabling confident decisions.
- This clarity helps to execute exact deals and lowers the guessing involved.
Limitations :
- False Signals :
- Should not be verified with volume, occasionally they provide false signals, therefore causing losses.
- Verifying signals with other signs is absolutely vital to prevent false information.
- Requires Patience :
- Calls for patience since the formation can take time and traders should wait for confirmation before acting.
- This patience is required to guarantee the accuracy of the signals and prevent hasty decisions possibly expensive.
Comparing with Other Chart Patterns :
- Often likened to the head and shoulders design is the triple top motif.
- Though both show reversals, the triple top is easier and offers more unambiguous signals.
- Still, the head and shoulders pattern may have more important pricing targets.
- Advice on including triple tops into trading plans
Combine with Indicators :
- Further confirmation, mix with indicators RSI and moving averages.
Back test :
- Always back test your ideas to make sure they work.
Stay Updated :
- Keep current with market events that can affect the trend.
Risk Management :
- Never undervalue stop-loss rules in safeguarding your wealth.
Conclusion :
- Technical analysis still depends much on the triple top pattern.
- As artificial intelligence and machine learning develop, the future promises improved pattern detection skills, so providing even more exact trading chances.

Frequently Asked Questions :
What is a triple-top pattern?
Answer :
- Applied in technical analysis, a triple top pattern is a bearish reversal chart pattern.
- Three peaks at almost the same price level define it, then a breakdown below the support line links the lows between the peaks.
- This trend suggests a probably declining price of the asset.
How can I identify a triple top pattern?
Answer :
See for the following to spot a triple top pattern:
- First Uptrend: An uptrend before the pattern starts.
- Three Peaks: Three separate peaks occurring at comparable pricing levels.
- Support Line: One horizontal line linking the lows between the peaks.
- Breakdown Confirmation: As the price crosses the support line, volume rises noticeably.
What role does volume play in verifying a triple top pattern?
Answer :
- Confirming a triple top pattern depends much on volume since it shows the strength behind the price movement.
- A notable rise in volume during the breakdown below the support line validates that the market mood has changed from bullish to bearish, therefore supporting a more solid proof of the price drop.
How can I verify a triple top pattern with technical indicators?
Answer :
- Technical indicators like the Relative Strength Index (RSI) help you to verify overbought circumstances that sometimes lead before a reversal.
- Moving averages also enable one to detect changes in the price trend, so supporting the triple top pattern.
What are typical entry and exit techniques for trading the triple top pattern?
Answer :
- Method of Entry : Enter a short trade after the price moves below the support line with verifying volume.
Method of Exit : Measuring the distance from the support line to the peaks, then subtracting it from the breakdown point, determines a target price. Control risk by putting a stop-loss order above the last peak.
Does the triple top pattern have any restrictions?
Answer :
- Indeed, the triple top pattern is limited. Sometimes it sends misleading indications if the breakdown is not verified with volume.
- Furthermore, the development of the pattern could take time, hence, traders must be patient and wait for unambiguous confirmation before making a trade.


