The Bullish Expanding Triangle Pattern : A Complete Guide for Traders
Introduction :
In the field of technical analysis, chart patterns are absolutely important for estimating market moves. One such rather strong pattern is the Bullish Expanding Triangle Pattern.
- Forex traders, stock market aficionados, technical analysts, and day traders all love this pattern—known for its dependability and efficiency.
- The technical analysis strength of the Bullish Expanding Triangle pattern, with real-time examples and professional advice, learn how to spot this pattern, evaluate its relevance, and apply sensible trading techniques to improve your trading performance.
But just what is the Bullish Expanding Triangle Pattern, and how may it improve your trading tactics? We shall discuss the structure, identification, relevance, and trading techniques connected with this amazing pattern in this complete tutorial.
Knowing the Pattern’s Structural Characteristics :
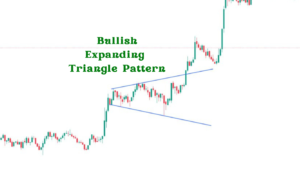
- Two different trend lines define the Bullish Expanding Triangle Pattern, sometimes called the Broadening Formation.
- Whereas the lower trend line slopes down to produce an expanding form, the top trend line slugs upward. Usually indicating an ongoing conflict between buyers and sellers, this trend develops during moments of great volatility.
Important characteristics of the Bullish Expanding Triangle Pattern consist in:
Higher highs and lower lows :
- Higher highs and lower lows produced by the price action cause the triangle to stretch throughout time.
- Usually, this trend reflects growing market volatility and uncertainty as buyers and sellers drive prices to new extremes.
Volume patterns :
- As the pattern develops, volume usually rises to show traders’ increasing curiosity and involvement. The increasing volume points to more market players becoming involved, which might cause greater price swings and possible breakouts from the developing trend.
How to Identify the Bullish Expanding Triangle Pattern on Charts :
- On charts, identifying the Bullish Expanding Triangle Pattern needs both careful observation and analysis.
- This trend is a rather good guide of possible market price change.
- This is a detailed tutorial to enable you precisely identify this trend:
Find the diverging trend lines :
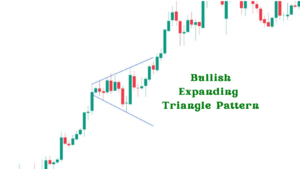
- Start by spotting two divergent trend lines in which one trending upward and the other downward.
- These lines have to be obviously different over time and should be touching the highs and lows of the price movement appropriately.
Verify Higher Highs and Lower Lows :
- See if the price movement is producing a sequence of higher highs and lower lows. This will create the Bullish Expanding Triangle’s defining expanding form.
- It is imperative to confirm that every next high is above the last high and every next low is below the last low.
Examine Volume Trends :
- As the trend emerges, search for rising volume to validate rising market interest.
- Rising volume during triangle formation usually means that traders are establishing positions with expectation for a notable price movement.
- Focus especially on volume spikes since they can offer further evidence of the validity of the pattern.
- Following these guidelines and focusing on these particular elements will help you to increase your capacity to recognize and use the Bullish Expanding Triangle pattern in your trading plan.
- These guidelines will help you to precisely recognize the Bullish Expanding Triangle and get ready for possible trade chances.
Examination of the Significance of the Pattern in Technical Analysis :
- Technical analysis benefits much from the Bullish Expanding Triangle pattern. It is a time of consolidation and uncertainty in which sellers and buyers are fiercely vying.
- Usually, the ultimate breaking from the trend results in significant price swings.
Professional analysis on the Bullish Expanding Triangle Pattern relevance :
- “The Bullish Expanding Triangle since it is a strong signal that usually precedes notable price swings.” Forex and cryptocurrency trader John Doe says.
- “Understanding the psychology behind chart patterns is as crucial as recognizing them. The Expanding Triangle shows buyers and sellers’ continuous conflict, the final breakout points to a winner. Jane Smith, analyst of the stock market
Bullish Expanding Triangle Pattern Real-Time Examples :
Let’s investigate several real-time instances to completely understand the possibilities of the Bullish Expanding Triangle Pattern:
1. EUR/USD. In the Euro zone Debt Crisis :
- The EUR/USD pair showed a Bullish Expanding Triangle pattern throughout the debt crisis of the Euro zone.
- The trend showed a change in market attitude, which once the breakout happened resulted in a notable upswing.
2. Apple Inc. Stock Through Changing Market Conditions :
- Apple Inc.’s shares saw the Bullish Expanding Triangle amid a period of market turbulence.
- The next breakout showed the dependability of the pattern in stock trading by resulting in a significant rise.
3. Trading History of Bitcoin :
- The trading past of Bitcoin further emphasizes the efficiency of the Bullish Expanding Triangle.
- The trend has shown itself several times, proving its dependability in forecasting notable price swings in bitcoin markets.
Methods for Trading the Expanding Triangle Bullish :
Trading the Bullish Expanding Triangle calls both strategic preparation and discipline along with patience. These are some practical tactics:
1. Await a confirmed breakout :
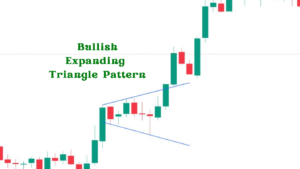
- Trading this trend requires patience; Wait to start a trade for a confirmed breakout over the upper trend line.
- This lowers false signal risk and improves trading results.
2. Use Multi Time Frames :
- Examine the trend throughout several periods to have a whole knowledge of market dynamics. This method clarifies the validity of the trend and possible direction of breakout.
3. Combine with Other Technical Indicators :
- Combining the Bullish Expanding Triangle with additional technical indicators including moving averages, RSI, and MACD improves your trading approach. This gives more proof and raises the possibility of profitable trading.
Expert advice:
- “Patience and discipline are absolutely vital while trading the Bullish Expanding Triangle Pattern. Trade results can be much improved by waiting for a proven breakout and controlling risk with appropriate stop losses”. Momentum Trader Alex Johnson
Risk Management and Stop Losses :
Trading the Bullish Expanding Triangle calls for good risk control. Review the following advice:
Set stop losses less the lower trend line :
- To prevent any false breakouts and reduce losses, place stop losses somewhat below the lower trend line.
Calculate Position Size Drawing on Risk Tolerance :
- Your risk tolerance and trading approach will help you to choose your position size.
Monitor Market Conditions :
- Track market circumstances constantly and change your stop losses and position size as necessary.
Expert insight:
- “While no pattern is foolproof, the Bullish Expanding Triangle Pattern, when combined with other technical indicators and a strong risk management strategy, can provide high probability trading opportunities.” Michael Lee
Conclusion :
For traders in different markets, the Bullish Expanding Triangle pattern presents insightful analysis and chances. Your trade will improve if you know its structure, find it on charts, and apply sensible trading techniques.

Frequently Asked Questions :
What is the Bullish Expanding Triangle pattern?
Answer :
- In technical analysis, the Bullish Expanding Triangle pattern is a chart pattern distinguished by opposite trend lines, one sloping upwards and the other downward.
- It refers to a period of consolidation and rising market interest, usually which causes big price swings upon breakout.
How can I recognize a Bullish Expanding Triangle Pattern?
Answer :
- Search a price chart for two divergent trend lines to spot a Bullish Expanding Triangle pattern.
- Verify higher highs and lower lows in the triangle and examine volume patterns to guarantee rising market interest.
- Accurate identification of this trend depends mostly on patience and accuracy.
What is the trading significance of the Bullish Expanding Triangle Pattern?
Answer :
- The Bullish Expanding Triangle Pattern is significant since it can show a possible breakout.
- A breakout usually marks a winner as both buyers and sellers battle within the pattern, which causes significant price movements.
- For traders seeking for high probability trading prospects, this makes the pattern valuable.
What kinds of markets does the Bullish Expanding Triangle Pattern work for?
Answer :
- Forex, equities, and cryptocurrency are just a few of the markets you might use the Bullish Expanding Triangle Pattern throughout.
- For any of these markets, its pattern recognition can reveal notable price swings, which makes it a flexible instrument for traders.
What are the risks of trading the Bullish Expanding Triangle Pattern?
Answer :
- Trading the Bullish Expanding Triangle Pattern carries hazards, much like any trading approach.
- Effective risk management—that is, establishing stop losses below the lower trend line and modifying position sizes depending on risk tolerance—may help to reduce the possibility of false breakouts and hence possible losses.
Can I combine the Bullish Expanding Triangle Pattern with other indicators?
Answer :
- Indeed, your trading approach will be improved by combining the Bullish Expanding Triangle Pattern with other technical indicators including moving averages, the Relative Strength Index (RSI), and Moving Average Convergence Divergence (MACD).
- These signs offer more validation, so raising the possibility of good trades.

