Learn Double Top Chart Patterns : A Complete Guide for Traders
For traders, chart patterns are priceless tools as they offer important understanding of price swings and possible reversals.
- Of them, the double top chart pattern is one of the most striking markers of market mood and trend reversals.
- Offering insightful analysis and techniques for day traders, technical analysts, and stock market aficionados, this thorough guide will investigate the nuances of the double top chart pattern.
Let’s learn how to master the double top chart pattern to maximize trading performance
- This all-inclusive guide addresses formation, volume importance, entry and exit points, actual market examples, frequent errors, and advanced techniques to improve your technical analysis ability.
- Perfect for investors wishing to make wise financial market judgments, technical analysts, and daily traders.
Introduction to the Double Top Chart Pattern :
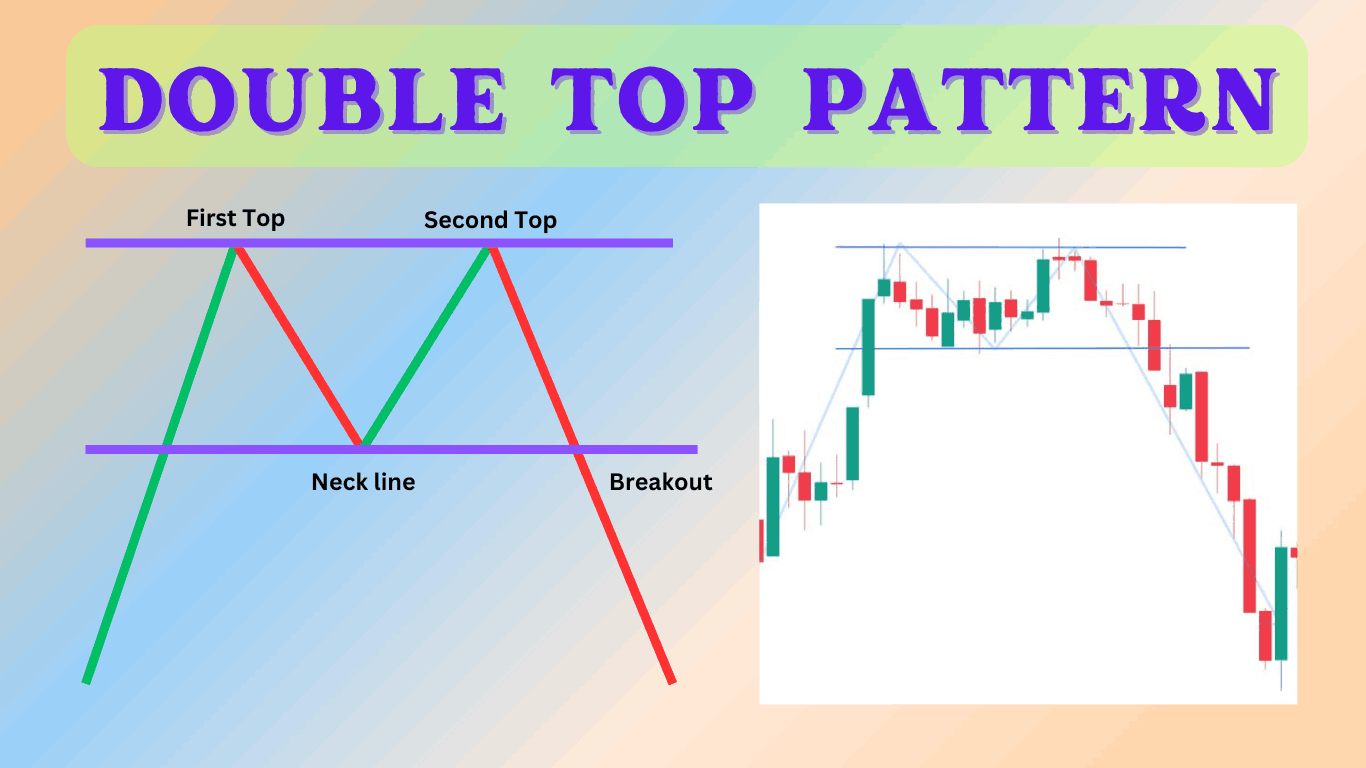
- Common reversal pattern that indicates a change from an uptrend to a downtrend is the double top chart pattern.
Its unique “M” form—formed by two peaks at about the same price level separated by a trough—makes it readily identifiable.
- Traders have been able to abandon long holdings or initiate short ones because to the dependability of the double top pattern in historically indicating bearish reversals.

Historical Relevance :
- Technical analysis books have long recorded double top patterns, which have shown dependability.
- They show a possible change in momentum from buyers to sellers as they show the incapacity of a market to surpass a resistance level twice.
Understanding the Formation Process :
The development of a double top pattern consists in several important phases, each offering important understanding of the behavior of the market:
Uptrend :
- The price initially climbs upward in a strong uptrend, producing a notable peak called the first top.
- Often motivated by positive market attitude and rising purchasing activity is this high.
Pullback :
- A pullback results from the price falling to a support level following the initial high, creating a trough.
- This retreat results from some traders beginning to take gains, momentarily decreasing the price.
- The support level serves as a floor, stopping more drop and driving the price to go other direction.
Second Peak :
- Driven by revived purchasing desire, the price starts to climb once more.
- But this time the price finds a second peak at a level comparable to the first top and fails to beat the prior high.
- This lack of breaking the past high points to declining purchasing power and possible market uncertainty.
Breakdown :
- At last, the price moves below the trough level, therefore verifying the double top pattern.
- Often heralding a negative reversal, this breakdown heralds the end of the uptrend.
- This confirmation can help traders predict further losses and modify their plans.

Role of Price Action :
- Forming the double top pattern depends much on price activity. The first top results from the price initially peaking then retreating.
- Not able to top this first peak on a later rise suggests declining positive momentum.
- Many times, traders look for this indicator as a first clue of a possible reverse.
- The trend is validated when the price falls down below the lowest point between the two peaks, therefore indicating a turn toward negative sentiment, and fails to maintain its level.
- This breach is crucial as it indicates that sellers are regaining power, which can cause more price falls.
- Knowing these fluctuations guides traders toward wise market selections.
Value of Volume in Validation of the Pattern :
- Validating the double top pattern depends critically on volume as it offers important understanding of the behavior of the market and the validity of the pattern.
Here is a thorough analysis of the several reasons volume counts:
Increasing Volume at Peaks :
- High trading activity accompanying the development of the peaks suggests notable investor and trader purchasing interest.
- Often confronted with an equally strong selling pressure when the price hits its high, this purchasing interest indicates that market players are either closing positions or making gains, therefore helping to produce the first and second tops.
Declining Volume at Trough :
- During the pullback phase—that is, the trough—a clear drop in volume indicates a lack of buyer excitement to drive the price upward.
- This lower purchasing activity points to a slowing down of momentum and insufficient interest to sustain a continuous price increase.
- One important clue indicating a possible reversal is the dropping volume at this point.
Breakout Volume :
- Confirming the veracity of the pattern depends on a significant increase in volume when the price falls below the trough level.
- This breakout volume shows that sellers are controlling the market and reflects significant belief in the declining price direction.
- The double top pattern would be less dependable and the breakout would be regarded as weak or fake without this large rise in volume.
- Examining volume trends provide the required validation that the double top pattern is a real reversal rather than a deceptive signal.
- Traders and investors may have faith in the authenticity of the double top pattern and make more wise trading decisions by constantly tracking volume fluctuations during the development of peaks, troughs, and breakouts.
- This thorough awareness of volume dynamics improves the efficacy of technical analysis by helping to distinguish between actual reversal signs and only market noise.

Identifying Entry and Exit Points :
Effective trading depends on exact identification of entrance and exit locations.
The following describes how to accomplish it:
Entry Points :
- Breakout Confirmation :
- Enter a short trade when significant volume clearly breaks below the bottom line.
- This suggests great selling pressure and raises the possibility of a continuous down trend.
- Retest of Breakdown Level :
- Should the price retest the breakdown level (prior support now serving as resistance), it offers a supplementary entry point to help prevent false signals.
- Usually, this retest occurs when traders who missed the first breakthrough are seeking an opportunity to join the market.
- Before you take your trade, confirm the retest using other bearish indications or a rejection candle.
Exit Points :
- First profit target:
- Subtract from the breakdown level an initial profit objective equal the height of the pattern—that is, the distance from the highest peak to the trough).
- This approach guarantees that your profit objective is reasonable and grounded on past pricing swings.
- Change your aim depending on volatility and state of the market to maximize possible benefits.
- Trailing Stop Loss:
- Lock in gains when the price swings in your advantage with a trailing stop-loss order.
- This approach lets you profit from long declining trends and guard your profits should the market turn around.
- Establish the trailing stop at a percentage or dollar value that strikes a mix between risk and return, then change it often depending on price activity and market volatility.

Common Mistakes to Avoid When Trading Double Top Patterns :
Misidentifying Patterns :
- One often occurring error is misidentifying patterns. Make sure the two peaks are at comparable pricing and that the dip clearly divides them.
Ignoring Volume :
- Ignoring volume changes could produce erroneous indications. Check the pattern always using suitable volume analysis.
Early Entries :
- Starting a trading before the breakdown confirmation might be dangerous. Wait for the price to significantly go below the trough level in volume.
Techniques Improving Double Top Pattern Trading :
Combine the indicators :
- Combining the double top pattern with technical indicators like RSI or MACD can improve trade dependability.
Use Multiple time frames.
- Examine the double top pattern over several time frames to validate it. More dependable patterns show up on daily and weekly charts.
Practice patience :
- Trade double top patterns calls for great patience. Before making transactions, wait for unambiguous confirmation indications; stay away from hasty judgments.
Conclusion :
- Ultimately, for traders, the double top chart pattern is a useful tool providing understanding of possible trend reversals.
- Understanding its development, relevance of volume, and appropriate entry and exit locations helps traders improve their trading plans.
- Using cutting-edge strategies and avoiding typical errors can help you to increase your trading success.
- Mastery in double top pattern trading depends on patience and ongoing education.

Frequently Asked Questions :
What does a Double Top Chart Pattern mean?
Answer :
- Comprising two peaks at about the same price level and a trough separating them, a double top chart pattern is a bearish reversal pattern that follows an uptrend.
- It points to a possible change from optimistic to pessimistic attitude.
How would volume confirm a double top chart pattern?
Answer :
- Confirming a double top chart pattern depends on volume in great part.
- While increased volume during the break below the trough level validates the validity of the pattern, high volume at the peaks signals considerable buying interest followed by notable selling pressure.
When should I start trading using a double top chart pattern?
Answer :
- Enter a trade when the price clearly moves below the low point with great volume.
- Another option is to do a retest of the breakdown level, in which case the past support now functions as opposition.
What Common Mistakes Should One Avoid Regarding Double Top chart Pattern Trading?
Answer :
- Typical errors include misidentifying trends, neglecting volume patterns, and starting trades early before the break-through confirmation.
- Verify with volume analysis to make sure the peaks have comparable price levels; then, wait for obvious signs.
Could I apply the Double Top chart Pattern in Forex and Stock markets?
Answer :
- Indeed, both stock and currency markets might be using the double top pattern.
- Across many financial instruments, the ideas of formation, volume relevance, and entry/exit strategies remain the same.
How may my double top chart pattern trading approach be improved?
Answer :
- Analyzing patterns across several periods, integrating the double top chart pattern with additional technical indicators like RSI or MACD, and learning patience to wait for unambiguous confirmation signals can help you improve your trading technique.


