The Symmetrical Triangle Pattern : A Complete Guide for Traders
Overview of the symmetrical triangle pattern :
Traders and analysts in the often-changing realm of financial markets search for consistent trends to forecast price fluctuations and maximize their activities.
- Of these patterns, the symmetric triangle pattern is one of the most effective technical analysis tools.
- Using our thorough guidance, learn how to trade the symmetrical triangle pattern successfully.
- Learn market psychology, discover entrance and exit methods, and investigate actual case studies spanning stock, forex, and Cryptocurrency markets. Increase your trading success and confidently negotiate financial markets
- The importance of this pattern is its capacity to indicate possible breakouts, therefore enabling traders to position themselves deliberately.
We will explore the symmetric triangle pattern in this guide, including its formation, identification, interpretation, and pragmatic application across several financial markets, including forex, stocks, and cryptocurrencies.
- including the symmetric triangle pattern in this guide, Whether your trading style is day-based, financial analyst, or crypto enthusiast, knowing this pattern can help you strengthen your market awareness and modify your trading plan.
Understanding the Formation of the Symmetrical Triangle Pattern :

Key Characteristics and Requirements :
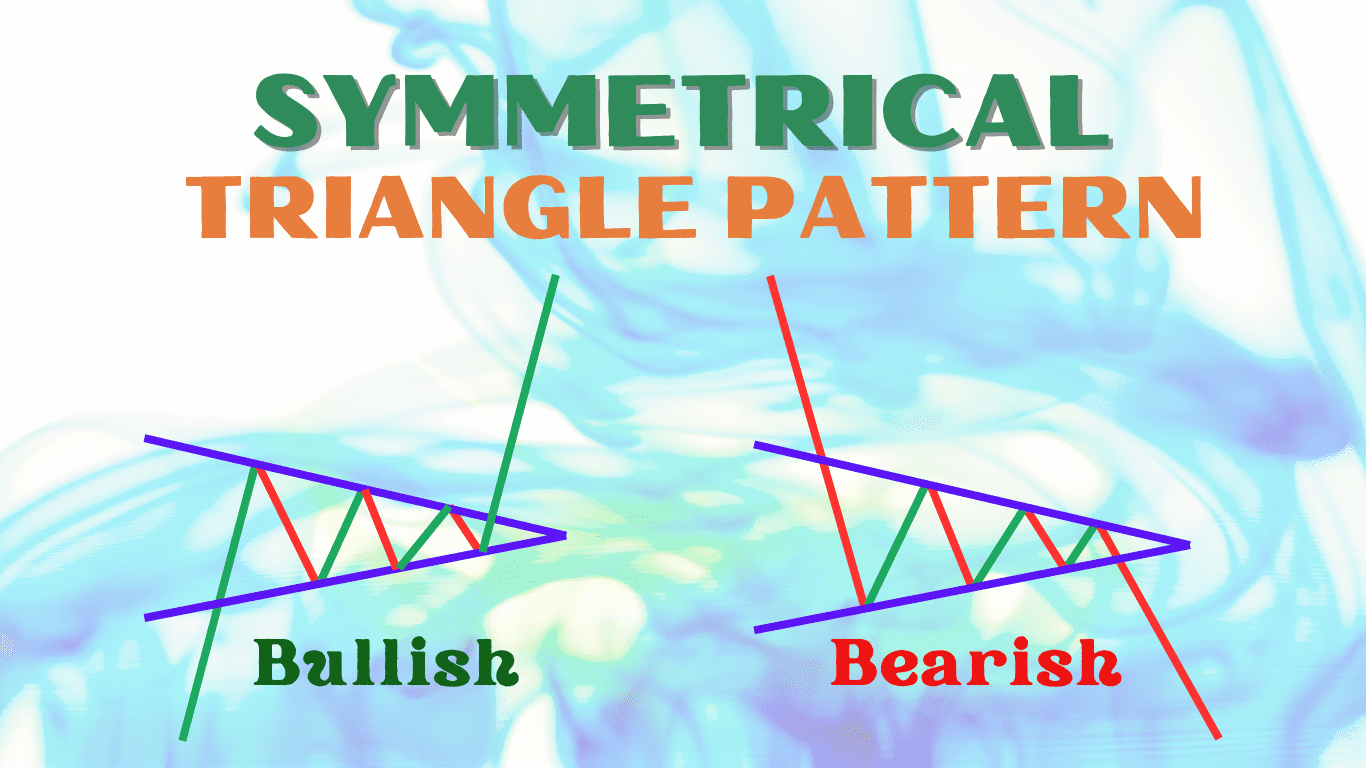
- Convergent trend lines creating a triangular form on the price chart define the symmetric triangle pattern.
- The salient characteristics of it are broken out here:
Two convergent trend lines :
- One rising (lower trend line) and one declining (upper trend line)—shape the pattern. These trend lines come together at what is sometimes called the apex.
Higher Lows and Lower Highs :
- Reflecting a period of consolidation and market uncertainty, the price action inside the triangle produces a sequence of higher lows and lower highs.
Duration :
- From a few weeks to several months, symmetrical triangle patterns can develop across numerous time frames.
- The breakout is probably more important the longer the length of time involved.
Formation Example :
- The picture above shows a traditional symmetric triangle pattern.
- See how the price swings between the convergent trend lines, progressively narrows until a breakout happens.
Finding the Symmetrical Triangle Pattern in Real-Time Charts :
Useful Illustrations from Many Financial Markets :
Example – I : The Forex Market
- Over three months, a symmetrical triangle pattern developed over the EUR/USD currency pair.
- Traders noted a possible breakout indicated by the pair’s higher lows and declining highs.
Example – II : The Stock Market
- For a well-known tech stock, over six weeks it displayed a symmetric triangular pattern.
- The price of the stock showed increasing triangle-based volatility, which sparked expectations for a notable price movement.
Example – III : The Cryptocurrency Market
- An example of a symmetric triangle pattern in the bitcoin (BTC) market during a period of consolidation Closely observing this trend, crypto traders expected a breakout that would cause a significant price rise or fall.

Understanding the symmetrical triangle pattern :
Entry and Exit Point Strategies :
- Maximizing gains and lowering risks depend on knowing how to trade the symmetrical triangle pattern efficiently.
Entry Points :
- One should wait for a proven breakout either above or below the trend lines.
- Should the price stray over the upper trend line, enter a long position, should it stray below the lower trend line, enter a short position.
Stop Losses :
- To guard against fake breakouts, place stop-loss orders somewhat outside the opposite side of the breakout.
Profit Targets :
- Project possible profit targets by determining the triangle’s broadest points’ distance from one another.
- Often added (for bullish breakouts) or subtracted from the breakout point, this distance is either positive or negative.
Example Trade :
- In the forex example already discussed, traders might set a stop-loss order below the lower trend line and an entry order somewhat above the upper trend line.
- Profit goals would be determined using the triangle’s calculated distance from its widest point.
The Symmetrical Triangle Pattern’s Psychology :
Market Psychology and Individual behavior :
- The symmetrical triangular design captures the uncertainty in the market. Buyers and sellers both delay during this phase, which narrows price swings.
- This period of consolidation marks a balance of power where neither side rules.
- The tension rises as the pattern goes on, leading to a breakout that reflects the general attitude.

Typical Errors to Prevent in Trading the Symmetrical Triangle Pattern :
Understanding Risk Reduction and Pitfalls :
Premature Entries :
- Avoid making trades before a proven breakout. Common false breakouts are caused by early entries that could result in losses.
Ignoring volume :
- Confirming breakouts depends much on volume. Make sure the breakout supports a volume increase to confirm its strength.
Overlooking Market Context :
- Always keep in mind the larger market background and current trends.
- Larger trends can include symmetric triangles, hence knowledge of this background helps you make better trading judgments.
Case Studies and Success Stories :
Actual Case Studies of Effective Trades Employing the Symmetrical Triangle Pattern.
Example – I : The Stock Market
- Following an earnings announcement, one well-known tech stock showed a symmetrical triangular pattern.
- Those who saw the trend and bided their time for a breakout paid off handsomely.
- Two weeks after break-through, the price of the stock jumped by fifteen percent.
Example – II : The Forex Market
- The USD/JPY pair developed a symmetric triangle pattern on the forex market.
- Following the breakout approach, traders found a winning short bet, the pair dropped high pip over the following week.
Example – III : The Cryptocurrency Market
- During a time of market instability, the symmetric triangle pattern of Bitcoin presented a great trading opportunity. The breakthrough demonstrated the dependability of the pattern in the crypto market since it resulted in a 10% price rise within a few days.
Conclusion :
- In the toolkit of traders and analysts, the symmetric triangle pattern is rather useful. Its capacity to signal possible breaks presents chances for lucrative trading on several financial markets.
- Understanding the development, recognition, and interpretation of this pattern helps traders improve their approaches and guide their decisions.

Frequently Asked Questions :
What is a symmetrical triangle pattern?
Answer :
- A symmetric triangle pattern is a chart arrangement in which the price settles within two convergent trend lines, therefore indicating a time of market uncertainty.
- It shows buyers’ and sellers’ balance of strength, which finally causes a breakout in either direction.
How do I recognize a symmetrical triangle pattern?
Answer :
- Look for a sequence of lower highs and higher lows spanning over time to find a symmetrical triangular pattern with converging trend lines.
- Usually shown during a consolidation phase following a price movement, this pattern indicates a possible breakout once the price crosses one of the trend lines.
Does volume matter for symmetrical triangle trading?
Answer :
- Indeed, in trading symmetrical triangle formations, volume is absolutely important in verifying breakouts.
- A notable rise in volume following the breakout implies that the breakout is probably real and sustainable, therefore lowering the possibility of a false breakout.
What typical mistakes might one make while trading symmetrical triangle patterns?
Answer :
- Typical mistakes include early entries before a proven breakout, neglect of volume during the breakout, and disregard of the larger market setting.
- Before trading, traders should wait for a confirmed breakout, guarantee a jump in volume, and take note of the current market patterns.
Can you use symmetrical triangle patterns in all markets?
Answer :
- Indeed, symmetrical triangle patterns have application in many financial markets, including stocks, currencies, and forex.
- For traders in various markets, the ideas of spotting, deciphering, and trading the pattern stay constant, so it is a flexible instrument.


