Learn Bullish Symmetrical Triangle Pattern : Guide for Breakout Traders
- The power of Bullish Symmetrical Triangle Pattern in technical analysis by learning how to recognize this chart pattern, identify successful trades, and employ effective risk management strategies across stocks, forex and cryptocurrencies markets.
- Add depth and dimension to your trading skills with practical tips from various markets around the globe.
- Making wise trading selections depends on knowledge of chart patterns, the Bullish Symmetrical Triangle Pattern is one of the most consistent patterns that forecasts possible higher price moves.
Introduction to the Bullish Symmetrical Triangle Pattern :
What is Bullish Symmetrical Triangle Pattern ?
- Usually indicating their continuance in their original path, a Bullish Symmetrical Triangle Pattern is a continuation pattern developed during an uptrend.
- Extended out, this formation which consists of two converging trend lines connecting lower highs with higher lows forms an inverted triangle across many markets including stocks, Forex, and cryptocurrencies.

Why does this pattern find use in technical analysis?
- The Bullish Symmetrical Triangle Pattern helps technical analysts precisely project future market moves.
- Understanding this trend allows traders to get early warning of possible breakouts, thereby giving them enough time and position advantage before the price changes.
- In momentum trading techniques, price action trading methods, and day trading strategies especially it can be quite helpful.
Finding this Pattern :
Trend lines :
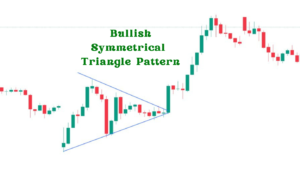
- Important traits of the symmetrical triangle that is bullish Two trend lines converging towards each other will help one to detect this pattern, an upper trend line linking lower highs and a lower trend line linking higher lows.
Volume:
- Volume usually decreases as the triangle pattern advances and price gets near to its pinnacle.
Breakout Point:
- A significant upward breakout occurs when price moves above its upper trend line with increased volume, signalling a continuation of bullish trending activity.
As an aid in understanding how to recognize this pattern, let’s examine some examples across a variety of financial markets:
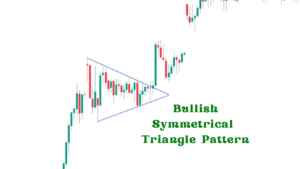
Example 1 : Stock Chart
- This example presents a visual depiction of a Bullish Symmetrical Triangle Pattern on a stock chart, including convergence of trend lines between upper and lower trends, as well as breakout point where price moves significantly upward.
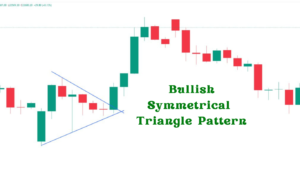
Example 2 : Forex Chart
- Here we illustrate the pattern on a forex chart, showing not only its convergence of trend lines but also the crucial reduction in trading volume usually associated with formation of this pattern, followed by a significant breakout that signals potential trading opportunities.
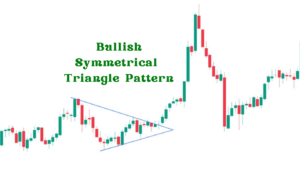
Example 3 : Crypto Chart
- This historical chart of Bitcoin illustrates the formation and successful breakout of an ongoing pattern, providing traders with insight into its impactful playback in an unpredictable cryptocurrency market with clear markers showing buildup and eventual breakout, helping traders anticipate similar movements in future. Understanding the Psychology Behind the Pattern.

Market Sentiment and Trader Behavior :
- The Bullish Symmetrical Triangle Pattern indicates a period of consolidation where neither buyers nor sellers hold the upper hand, as a result, prices narrow and converging trend lines form. Psychological considerations behind this pattern include:
Indifference and Consolidation :
- Uncertainty arises among traders regarding their next move, leading to reduced volatility and volume.
Accumulation Phase :
- Buyers gradually build positions anticipating an optimistic breakout of prices.
Breakout Confidence :
- Once price breaks above the upper trend line, traders gain more trust that its bullish trend will persist, leading to increased buying pressure.
Why It Indicates Upward Movement :
- A breakout above the upper trend line indicates that buyers have overcome sellers’ resistance, often leading to an upsurge of buying activity which usually propels prices higher and confirms bullish continuation.
Real World Examples :
Formation :
- Bullish Symmetrical Triangle Pattern was formed over three months with gradually converging trend lines and distinct breakout points above both upper trend lines.
Entry Point :
- Entry was identified upon breakout above upper trend line with increased volume.
Stop Loss Placement :
- Stop Loss Placement should be placed just beneath lower trend line to minimize losses.
Profit Achieved :
- Gained 15% in Stock Value over several weeks.
Scenario :
- Following GBP/USD Forex Pair and its related patterns and scenarios.
Breakout :
- Occurred With Significant Spike in Volume and Verified an Upward Trend.
Successful Trade :
- Produced a profitable trade by entering near the breakout and exiting near its projected price target.
Historical Chart :
- Displayed a Bullish Symmetrical Triangle Pattern during consolidation phases.
Trade Execution :
- Entered at the breakout point and held through its subsequent price increase.
Significant Price Increases :
- Accurately predicted an upward movement, leading to substantial profits.

Equity Market Analysis :
Analysis :
- Utilizing both technical and fundamental analysis, I used Bullish Symmetrical Triangle patterns as indicators of strong potential bullish momentum.
Long Position Entry :
- Successfully entered a long position by taking advantage of an upward price movement.
Timing :
- Highlighted the importance of precise timing when day trading.
Pattern Application :
- The Bullish Symmetrical Triangle Pattern provided clear entry and exit points, making for an efficient trading session with profitable day trades.
Profitable Day Trade :
Capitalizing on its break out proved profitable day trading session. Tips for Trading with this Pattern, Entry & Exit Strategies.
Entry and Exit Strategies :
Entry Strategy :
- Enter long when price breaks above upper trend line with increased volume.
Exit Strategy :
- Consider setting an exit price target equal to the height of triangle added at breakout point or trailing stops so as to capture more of upward movement.
Stop Loss Placement :
- Stop-loss orders should be placed just below the lower trend line to guard against false breakouts and limit potential losses.

Risk Management :
Position Sizing :
- Define your position size based on your risk tolerance and distance between entry point and stop-loss level.
Diversification:
- Investing all your money in one trade is not advisable, instead, diversify your portfolio to distribute risk among several assets.
Conclusion :
- In technical analysis, the Bullish Symmetrical Triangle Pattern is a great tool that provides traders with insightful analysis of possible upward market movement.
- Understanding how to identify this pattern and its psychological consequences as well as possible trading techniques for using it will help traders make better decisions and raise their possibilities of success.

Frequently Asked Questions :
What Is a Bullish Symmetrical Triangle Pattern?
Answer :
- A Bullish Symmetrical Triangle Pattern is a chart pattern created during price consolidation when highs gradually decline while lows increase, producing two converging trend lines which indicate potential bullish movement upon breaking above either trend line.
How would one spot a Bullish Symmetrical Triangle Pattern?
Answer :
- Watching for price movements where highs and lows converge towards each other over time and volume progressively declines during consolidation phase, then rises when breakout takes place may help you to spot a Bullish Symmetrical Triangle Pattern.
- This pattern should also show signs of growth over time as more traders invest in its bullish potential.
When should I enter my trade using this pattern?
Answer :
- You should consider entering your trade when price breaks above the upper trend line of a Bullish Symmetrical Triangle Pattern with increased volume.
- This signifies the possibility of further bullish trend continuation and offers an ideal entry point for long positions.
What are some effective stop-loss strategies for trading this pattern?
Answer :
- To protect against false breakouts and minimize potential losses, one effective stop-loss strategy for this pattern would be placing a stop-loss order just below its lower trend line, this allows for optimal protection from false breakouts while minimizing losses.
- Alternatively, trailing stops can help dynamically manage risk as price changes in your favor.
What applications of the Bullish Symmetrical Triangle Pattern exist across markets?
Answer :
- From stocks to currency to cryptocurrencies, the Bullish Symmetric Triangle Pattern is seen in many markets.
- The principles behind pattern recognition, volume analysis and breakout strategies generally remain consistent between asset classes; making this pattern an invaluable trading tool.


