The Ascending Triangle Chart Pattern: A Practical Guide for Traders
Introduction to Ascending Triangle Chart Pattern :
In technical analysis, the ascending triangle chart pattern is a bullish continuation pattern most often seen.
- Characterized by two parallel resistance lines with upward sloping support lines, this formation shows the demand of an asset is progressively increasing over time and should give traders insightful analysis of possible price swings and trading prospects.
- This guide delves deeply into the intricacies of an Ascending Triangle Chart Patterns, from its structure and identification on various charts to effective trading strategies, real-life examples, common mistakes and its advantages and limitations.
- Identify and trade using the ascending triangle chart pattern with this comprehensive guide covering pattern recognition across stock, forex, and crypto markets, outlining effective trading strategies; providing real-life examples, as well as outlining potential missteps to avoid.
- Be armed with all of the tools and knowledge to master it for optimal trading performance.
Understanding an Ascending Triangle Chart Pattern :
- A well-known chart pattern in technical analysis, an ascending triangle chart pattern is distinguished by its unique form and two basic components, price movement and volatility.

Horizontal Resistance Line :
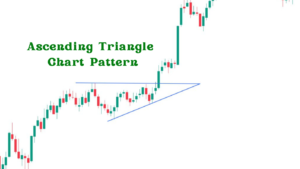
- This horizontal resistance line links all of the price movement peaks. It indicates where selling pressure consistently halts upward movement, at this level sellers often sell off their positions to create an immovable ceiling that resists price changes.
Rising Support Line:
- This rising trendline connects successively higher lows in price action, signifying buyers are increasingly willing to purchase at higher prices demonstrating growing bullish sentiment and stronger demand.
- It acts as a support level that keeps prices from sliding below its ascending trendline.
Volume:
- In general, volume will decrease over the course of an ascending triangle chart pattern as traders anticipate reduced trading activity and reduced volume trading activity.
- As the price nears its apex and traders anticipate potential breakout, often marked by an enormous surge in volume that underscores its strength and increases market participation.
Duration:
- The pattern typically develops over multiple weeks to months, giving price action time to form higher lows and test horizontal resistance multiple times.
- Its duration provides insights into its strength and predictability for subsequent breakout.
Breakout Direction:
- Breaking above a horizontal resistance line is one of the key indicators of an ascending triangle pattern, signalling its completion.
- A breakout above this horizontal resistance level suggests bullish momentum as previous resistance levels turn into new support levels; traders often view such breakouts as buying opportunities that signal further upward momentum.
- Knowledge of the ascending triangle chart pattern can provide traders with invaluable insight into potential price movements and market sentiment.
- By understanding its formation and characteristics, traders can make more informed decisions and capitalize on bullish trends more successfully.

Identifying an Ascending Triangle Chart Pattern on Stock, Forex and Crypto :
- Recognizing an ascending triangle chart pattern requires spotting its characteristic higher lows with horizontal resistances forming.
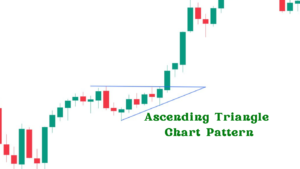
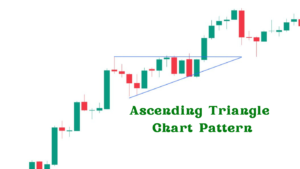
- Here’s how you can spot them across markets: When looking at stock charts it should look something like this: Indicating an Ascending Triangle:
Examples :
- Stock Charts : When scanning stocks, look for those exhibiting a horizontal resistance level with steadily higher lows.
- Forex Charts : In currency pairs, identify patterns in trending markets where resistance remains static while support moves upward.
- Crypto Charts : Cryptocurrencies often exhibit unpredictable trends, but an ascending triangle can be easily recognized by its steady rise in lows converging to form horizontal resistance levels.
visuals :
Include chart examples from each market that highlight resistance and support lines as well as volume trends. When an ascending triangle pattern has been identified, various trading opportunities present themselves – here are a few strategies:
Breakout Strategy :
- 1. Entry Point : Enter long positions when price breaks above horizontal resistance line with increased volume.
- 2. Stop Loss : To manage risk effectively, place a stop loss order just below last higher low price.
- 3. Target : Measure the height of the triangle and project it above the breakout point to set a profit target.
Pullback Strategy :
- 1. Entry Point : Wait until price breaks out before entering long position near resistance which has now become support.
- 2. Stop Loss : Place a stop-loss order below the new support line.
- 3. Target : Utilize triangle height as an entry/exit point when setting profit targets and provide practical application examples such as charts with entry/exit points.

Real-Life Examples of Successful Trades Utilizing the Ascending Triangle Chart Pattern :
Case Study 1 : Apple Inc.
- A stock trader observes an ascending triangle on Apple Inc.’s chart and follows it until its break above the upper trend line, entering long position three weeks later with 15% profit realized.
Case Study 2 : EUR/USD Forex Pair
- When forex traders identify an ascending triangle on the EUR/USD currency pair, they utilize a breakout strategy involving long trades when price closes above its resistance level and applying long after price closes above that resistance point.
Case Study 3 : Bitcoin (BTC)
- A crypto trader observes an ascending triangle pattern on the Bitcoin (BTC) chart during a bullish rally and enters at its breakout point to generate 25% profit within two weeks as BTC continues its upward movement.
Case Study 4 : Long-Term Growth Stock Investment
- An investor uses the ascending triangle pattern to time their entry into long-term growth stock positions, typically buying after its breakout and realizing significant returns over several months as its price continues to increase.
Mistakes to Avoid when Trading Ascending Triangles :
- One common pitfall when it comes to trading ascending triangles is overlooking volume confirmation, this could result in false signals or premature entries into trades.
- Entering trades prior to a definitive breakout can result in premature exits and losses.
- Ignoring Market Context Failing to consider market context may cause misinterpretations of pattern’s significance and inadequacies risk management practices.
- Failing to set appropriate stop-loss orders can expose traders to significant risks.

The Ascending Triangle’s Advantages and limitations :
Predictive Power :
- This pattern has an excellent track record in accurately forecasting bullish continuations.
Provides Definite Entry/Exit Points :
- Gives traders precise entry and exit points. Apply To Multiple Markets Including Stocks, Forex And Crypto Currencies.
Limitations :
- That Could Lead To Losses If False Breakouts Occur
Time Consuming :
- Exhibiting patience as the pattern forms over weeks or months requires.
Requiring Volume Confirmation :
- Without an increase in volume breakouts may not be reliable enough for long term results.
Conclusion :
- A trader’s toolkit would be much enhanced by the ascending triangle chart pattern.
- Traders can use this pattern to improve their trading performance by knowing its structure, precisely spotting it, and applying tested trading techniques on real-world based off genuine data points.
- Be mindful that, like with all trading strategies, success with ascending triangle chart pattern requires thorough analysis, disciplined execution and constant learning.
- Avoid common errors and consider all aspects of market conditions to increase your odds of success and be sure not to repeat previous mistakes.
Employ the power of ascending triangle patterns to take your trading to new heights.

Frequently Asked Questions :
What Is an Ascending Triangle Chart Pattern?
Answer :
- An ascending triangle chart pattern is a bullish continuation pattern which typically appears during an uptrend and is distinguished by two features; horizontal resistance lines and rising support lines which represent increasing buying pressure.
How can I identify an ascending triangle pattern in charts?
Answer :
- To recognize an ascending triangle pattern on charts, look for two characteristics.
- (a) A horizontal resistance level at which prices continually hit.
- (b) An increase in low prices that form the rising support line below it (known as an “Arcing Triangle Pattern).
How reliable is the ascending triangle chart pattern for trading?
Answer :
- Generally speaking, an ascending triangle chart pattern can be considered one of the more reliable chart formations, particularly in bullish markets, however as with any trading strategy it’s essential to verify breakouts with increased volume while being aware of potential false signals.
Is the ascending triangle chart pattern applicable in all markets?
Answer :
- Yes, this versatile trading strategy can be implemented across stocks, forex and cryptocurrency trading environments.
What happens if my breakout fails?
Answer :
- Failed breakout typically leads to a pullback towards its support level, therefore, traders should have an established risk management strategy, such as setting a stop-loss order at or just below this support line, in place in order to minimize potential losses and losses.


