Learn Bullish Falling Wedge Pattern : A Guide for Traders
Introduction :
- Unlock the power of Bullish Falling Wedge patterns in trading, learn to identify, confirm and trade this powerful continuation pattern using real-life examples, key indicators and effective strategies.
- Improve your trading outcomes by understanding market psychology and avoiding common pitfalls.
Definition and Basic Characteristics :
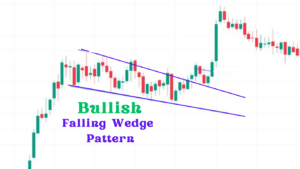
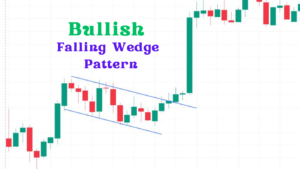
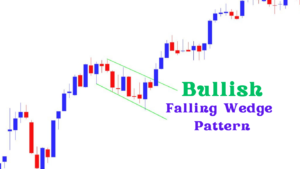
- The Bullish Falling Wedge Pattern is an effective continuation pattern in technical analysis that can signal an impending upward price movement.
- Recognizable by its characteristic shape, this continuation pattern features two converging trend lines with downward slopes which intersect at their respective confluence points to form this continuation pattern, its upper trend line acts as resistance while its lower counterpart acts as support.
Significance in Stock and Forex Markets :
- The Bullish Falling Wedge pattern has long been recognized across a variety of financial markets – stocks, forex and even cryptocurrency.
- Its significance lies in its ability to predict when an upward trend resumes after any period of retracement or consolidation, experienced traders and technical analysts recognize its high probability of success when recognized and executed correctly.
Identifying Bullish Falling Wedge Pattern :

Recognizing Price Chart Patterns :
To identify a Bullish Falling Wedge pattern on price charts,
Two converging trend lines :
- Two converging trend lines connecting series of lower highs while simultaneously connecting series of lower lows (upper trend line connects lower highs while lower trend line connects a series of lower lows).
Downward Sloping Trend lines :
- Both trend lines should slope downward, signifying diminishing volatility and narrower price action.
Decrease in Volume :
- As a pattern takes form, its volume generally declines indicating reduced trading activity as consolidation occurs.
Real-Time Examples :
- One example would be a tech stock daily chart where a Bullish Falling Wedge pattern can be observed, with annotations that highlight its convergence of trend lines, decrease in volume and eventual breakout above its upper trend line indicating potential rally.
Understanding Psychology Behind Pattern :

Explaining What Triggers the Pattern :
- Bullish Falling Wedge describes market behavior where buyers gradually regain control, even as prices decline, through gradual consolidation and an increasing volume.
- Sellers initially dominate, but their influence eventually weakens leading to higher support levels for buyers.
- Narrowing price range and volume decrease indicate pressure building up that may lead to an upward breakout from this pattern.
Insights into Buyer and Seller Dynamics During the Formation :
- As part of its formation, this pattern creates insights into buyer and seller dynamics during its formation, with sellers finding it increasingly challenging to push prices lower while buyers become increasingly confident and step in at higher lows.
- This dynamic creates converging trend lines, setting the stage for potential breakout when buyer pressure overtakes selling pressure.
Key Indicators to Help Confirm Entry Points :
Discussion on Volume Trends and Technical Indicators :
- Volume is a vital indicator when it comes to validating Bullish Falling Wedge patterns.
- A significant spike in volume during breakout shows strong buying interest and validates this pattern.
- Furthermore, look out for technical indicators such as an increase in relative strength index above 50 or MACD (Moving Average Convergence Divergence) producing a bullish crossover as further confirmation for entry.

Strategies for Entering Trades at Optimal Points :
- An optimal entry occurs when price breaks above an upper trend line with accompanying volume, providing traders an opportunity to place buy stop orders just above this trend line in order to capture this breakout.
- Setting a stop loss just below lower trend line helps mitigate risk, while profit targets should be set based on previous resistance levels or measured move equivalent to pattern height.
Bullish Falling Wedge Pattern in Action :
Case Studies of Successful Trades Utilizing the Pattern :
Case Study 1: Tech Stock Daily Chart
- This tech stock displayed a Bullish Falling Wedge on its daily chart.
- An entry point was identified when price breached above its upper trend line with increasing volume, and rallied following such entry point, providing significant potential profit potential.
Case Study 2: Forex 4-Hour Chart
- On the forex market, one currency pair displayed a Bullish Falling Wedge on a 4-hour chart.
- Utilizing volume and RSI as confirmation indicators, traders entered at its breakout and managed risk accordingly, yielding gains as it resumed its uptrend.
Case Study 3: Crypto Market Consolidation Phase :
- Crypto asset was trading within its consolidation phase when a bullish Falling Wedge pattern formed.
- After studying this formation, traders entered at the breakout point with profit targets based on historical resistance levels, this trade illustrated that such patterns are applicable across asset classes.

Analysis of Potential Profit Targets and Risk Management :
- You can set profit targets using Fibonacci retracement levels or previous resistance zones as targets, making adjustments depending on market conditions as necessary.
- Implementing a trailing stop can lock in profits while still leaving potential further gains open, with implementation also helping avoid false signals that might arise during pattern recognition.
How to Avoid False Signals :
- Misinterpreting Trend lines : Make sure the trend line connects at least two to three significant highs and lows.
- Ignoring Volumes: Breakouts without volume confirmation could produce false signals.
- Overlooking Market Contexts: Pattern reliability increases within an uptrend environment.
Tips for Filtering Out Unreliable Signals :
- Wait for Confirmation: Only enter trades when volume and other indicators have confirmed a breakout of any sort.
- Combine with Technical Analysis: Use additional tools like moving averages or oscillator signals to further confirm patterns.
- Stay Informed: Stay current on market news and events that could affect price action.
Conclusion :
- The Bullish Falling Wedge pattern offers traders opportunities to capitalize on resumptions in up-trends.
- Gaining insight into its characteristics, psychology, and confirmation strategies can significantly improve trading outcomes.
- Have You Considered Applying Bullish Falling Wedge Pattern in Your Trading Strategy

Frequently Asked Questions :
What is a bullish falling wedge pattern?
Answer :
- An indicator of technical analysis called a Bullish Falling Wedge pattern may indicate the start of a reversal or the continuation of an uptrend.
- The converging trend lines that prices follow as they gradually make lower highs and lows are what identify this pattern. Eventually, a bullish breakout of some kind results.
How Can I Verify a Falling Wedge Pattern That Is Bullish?
Answer :
- Technical indicators like an RSI (Relative Strength Index) moving above 50 and a MACD (Moving Average Convergence Divergence) showing bullish crossover are usually required to confirm a Bullish Falling Wedge pattern.
How can I identify optimal entry points for trading this pattern?
Answer :
- Optimal entry points can be identified when the price breaks above the upper trend line of a Wedge and accompanying spike in volume, prompting traders to place buy stop orders just above it in order to capture any breakout; setting a stop-loss below recent low can reduce risk further.
Are There Any Pitfalls When Trading the Bullish Falling Wedge?
Answer :
- Yes, trading a Bullish Falling Wedge may involve misinterpreting trend lines, disregarding volume confirmation on breakout, and failing to take account of its wider market context.
- To reduce these risks, ensure trend lines connect significant highs and lows, wait for volume confirmation on breakout, assess its patterns within its overall trend context, these steps should help manage these risks and make for successful trading outcomes.
Can different markets use the Bullish Falling Wedge pattern?
Answer :
- Indeed, this pattern works with stocks, currency, commodities, and cryptocurrencies among other asset types.
- Though its tenets never change, the asset class or market to which it is applied may require changes to confirmation and risk management techniques.


