The Bearish Pennant Pattern: Comprehensive Guide
Our comprehensive guide on mastering the Bearish Pennant Pattern will show you effective entry and exit strategies, real-time examples, volume and risk management to enhance your trading success across stocks, forex and crypto markets.
- Join advanced trading courses offered by professional traders for further strengthening your skills or sign up to join our community of professional traders
- Traders may benefit much from the Bearish Pennant Pattern, which offers insightful information about possible market downfall.
- Stock traders, novice investors, forex traders, and cryptocurrency traders looking to profit from unfavorable trends may find special benefit in this pattern.
In this comprehensive guide on this pattern you will discover everything necessary from identification through execution of profitable trades.
Understanding the Bearish Pennant Pattern:
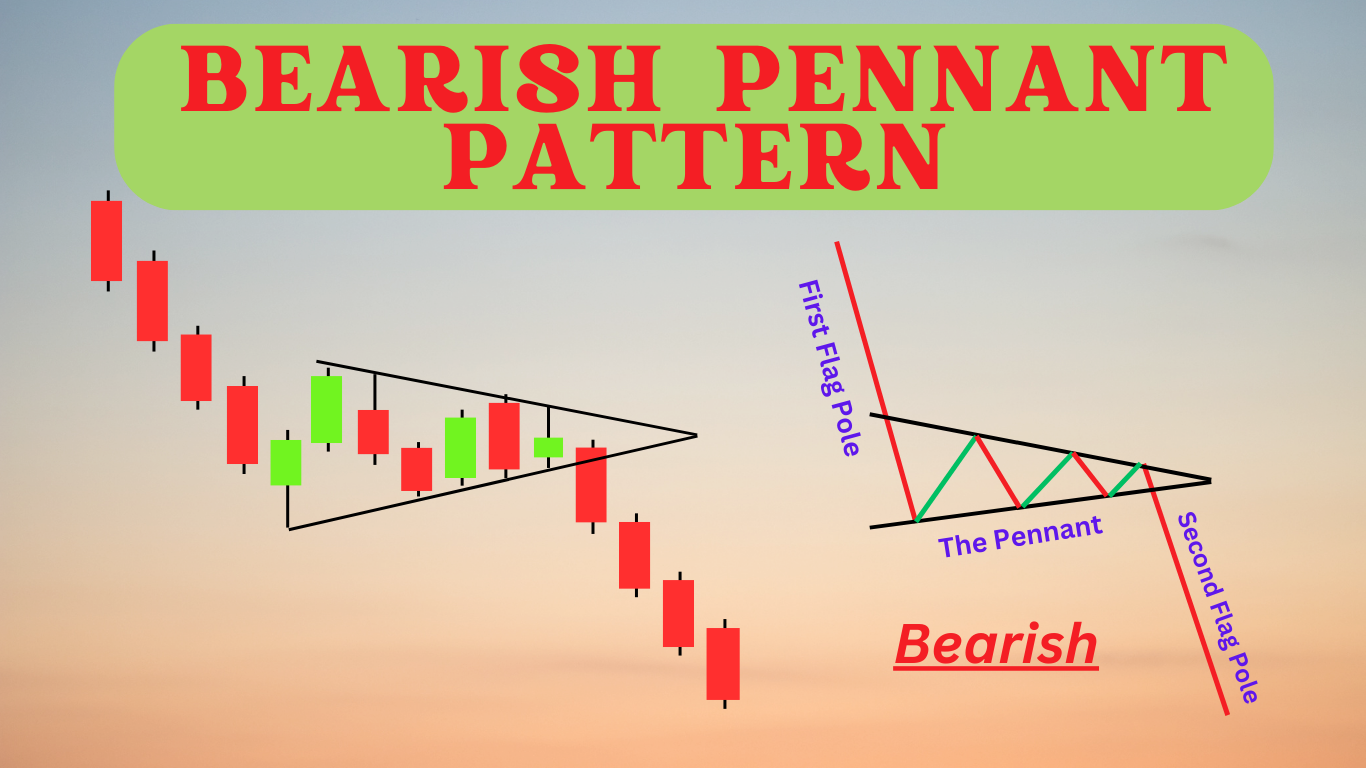
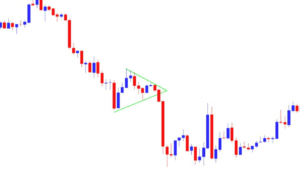
- Prices form a little symmetrical triangle called the pennant during the consolidation phase that follows the sharp decrease known as the flagpole in the Bearish Pennant Pattern.
- Usually following large price declines, this phenomena indicates that the market has momentarily paused before carrying on its declining trend.
- Consolidation periods provide temporary equilibrium between buyers and sellers while still maintaining bearish sentiment overall.
Key Components of an Uptrend Pattern:
Flagpole :
- The initial sharp decline in price which sets off an Uptrend Pattern. It often occurs quickly and sharply, signalling strong selling pressure.
Pennant :
- A short-term consolidation phase in which price moves within a converging range to form an symmetrical triangle, marked by decreasing volume indicating temporary equilibrium between bullish and bearish forces.
Breakout :
- When following the pennant phase, breaking out can mean continuing the downward trend after consolidation ends and typically follows its original flagpole direction, reinvigorating bearish selling pressure and reinforcing bearish trends.
Traders frequently use this pattern as an entry signal into short positions, expecting further price decreases. It serves as a reliable technical analysis indicator that shows market psychology and ongoing bearish momentum.
Bearish Pennant Pattern Recognition in the Stock, Forex, and Crypto Markets :
It takes close study of market activity and candlestick charts to identify a bearish pennant.
This technical analysis tool might help traders anticipate more downward movement in an asset’s price.
Here’s a step-by-step instructions:
1. Recognizing the Flagpole :
- To identify this pattern, look for a steep drop in price over a short time frame, driven by significant selling pressure – this should become apparent as soon as selling pressure increases significantly and forms part of its “flagpole.”
2. Recognize a Pennant :
- Keep an eye out for any consolidation phases where prices form small symmetrical triangles or pennants – these periods often represent temporary pauses in an ongoing downtrend and tend to stabilize price movements as trading volume tends to reduce.
3. Verify the Breakout :
- Watch for price to break below the lower trend line with increased volume, signalling renewed selling interest and reinforcing bearish momentum.
- A significant rise in trading volume should accompany such an event and signal its continuation as bearish momentum builds.
Trades can better position themselves to take advantage of any potential downward moves in the market and make more educated trading selections by doing these things.
Significance of Volume in Confirming the Bearish Pennant :
For traders to validate the Bearish Pennant Pattern, a technical analysis tool they frequently use to predict possible negative market movements, volume is essential.
- At the onset of pennant formation, volume typically reduces, signaling that sellers are taking a temporary respite as market consolidation occurs.
- This decrease in volume gives way for its characteristic shape to take place on the chart – creating the pennant.
- Once price breaks out of its pennant, an increased volume demonstrates its bearish momentum and provides traders with more confidence to continue with bearish trading decisions.
Recognizing such volume patterns is essential in making informed trading decisions.
Entry and Exit Strategies for Traders :
Implementing effective entry and exit strategies is crucial to taking full advantage of Bearish Pennant Pattern:
Entry Strategy :
- Enter when there has been confirmation that price has broken below its lower trend line of the pennant with increased volume.
Exit Strategy :
- Upon reaching target value on trade exit strategy should also be applied.
- Set your profit target based on the length of the flagpole.
Utilize trailing stops to secure profits as prices decline further.
Real World Examples of Bearish Pennant Patterns :
Gaining insight into real-time market situations will help strengthen your understanding of Bearish Pennant Patterns.
Example 1 : BTC Price Correction
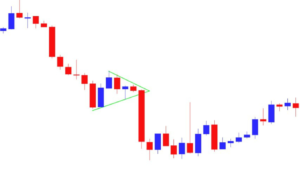
- Following a sudden price decline, a Bearish Pennant Pattern emerged after brief consolidation phase followed by further decline upon breakout of consolidation period.
Example 2 : Apple Inc. Bearish Pennant Pattern
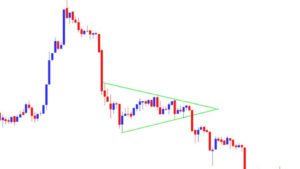
- When markets weakened, Apple Inc. experienced a bearish Pennant Pattern which confirmed continued market downtrend and provided for profitable short-selling opportunities.
- Its formation proved decisive and signaled continuation. Its formation signalled further decline, providing short-sellers with opportunities for short sales.
Example 3 : EUR/USD Forex Pair Behavior
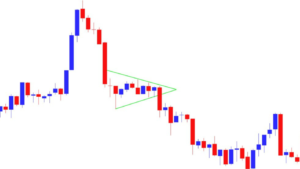
- Amid economic unease, the EUR/USD forex pair displayed a Bearish Pennant Pattern which signaled bearish trend continuation and provided forex traders with opportunities.
- Breakdown below this pennant signalled bearish trend continuation which made for ideal conditions.
Stop-Loss and Risk Management :
Risk management is of critical importance when trading the Bearish Pennant Pattern, an indicator of an upcoming downward trend that requires extreme care in mitigating losses.
- Utilizing stop-loss orders may protect against sudden market reversals, stop-loss orders are an effective means of safeguarding against unexpected price changes that could otherwise occur unexpectedly.
Set Stop-Loss Order :
- To prevent potential losses and if the market moves against your position swiftly, place a stop-loss order just above the pennant formation.
- This enables you to exit quickly should it move against you.
Position Sizing :
- To protect against market volatility and avoid major financial damage, allocate only a portion of your capital per trade to each transaction.
- Proper position sizing helps create a balanced portfolio while decreasing risks of large losses.
Adherence to these risk management strategies enables traders to more safely navigate the uncertainties involved with trading the Bearish Pennant Pattern.
Conclusion :
Mastering the Bearish Pennant Pattern can significantly boost your trading strategy across stocks, forex and crypto markets.
Knowing its structure, identifying key components and establishing entry and exit plans are vital steps toward successful trading.

Frequently Asked Questions :
What Is a Bearish Pennant Pattern?
Answer :
- Technical analysis chart pattern known as a bearish pennant pattern suggests that a declining trend may continue.
- It typically forms after significant price decline, followed by brief consolidation resembling a small symmetrical triangle (pennant).
- Once formed, confirmation comes when price breaks below lower trend line of pennant with increased volume.
How Can You Recognize a Bearish Pennant Pattern?
Answer :
- To spot a Bearish Pennant Pattern, search for an abrupt downward movement (flagpole), followed by a brief consolidation phase characterized by converging trend lines forming the pennant shape.
- A breakout below its lower trend line and accompanying increased trading volume should confirm its occurrence and complete this pattern.
What are the Key Components of a Bearish Pennant Pattern?
Answer :
- A Bearish Pennant Pattern includes three main elements, these are: Flagpole (initial steep decline), Pennant (consolidation phase with converging trend lines) and Breakout (price breaking below lower trend line of pennant).
- Volume plays a pivotal role during consolidation while dramatically increasing during breakout.
In trading a bearish pennant pattern, how should traders create stop-loss orders?
Answer :
- Traders who want to minimize possible losses during unanticipated market reversals should place their stop-loss orders slightly above a pennant formation.
- This allows a swift exit should markets move contrary to expectations, providing swift protection from sudden unexpected reversals in their financial portfolios.
Could the Financial Markets Use the Bearish Pennant Pattern?
Answer :
- Indeed, it works with cryptocurrency, FX, and stock markets.
- Whatever the kind of asset being traded, its fundamentals never change, which makes this pattern a priceless resource for traders trying to spot and profit from bearish trends.
