Learn Harami and Harami Cross Patterns in Technical Analysis :
- The basics of Harami and Harami Cross candlestick patterns used in technical analysis. Gain an understanding of these indicators can signal potential market reversals while augmenting your trading strategy using practical examples and tips.
Introduction to Candlestick Patterns :
Candlestick patterns are essential tools in the arsenal of any technical analyst, trader or investor.
- These visual representations of price movements provide invaluable insights into market sentiment, potential trend reversals and future price action.
Of all of the many candlestick patterns available today, Harami and Harami Cross patterns stand out for their predictability and predictive ability.
Understanding Harami Candlestick Pattern :
The Harami candlestick pattern is a two-candle formation that signals potential trend reversal.
- The name comes from Japanese for “pregnant,” as this two-candle formation resembles gestation.
A classic Harami pattern comprises one large candle followed by one smaller candle completely subsumed within its body similar to gestation.

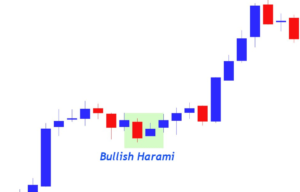
Bullish Harami :
- This pattern occurs during a downtrend when there is strong selling pressure and large bearish candles appear, signaling high selling pressure.
- These large bearish candles are then followed by two smaller candles that could either be bullish or bearish and serve to signal uncertainty or decreases in selling momentum, finally a smaller candle that completely engulfs its larger counterpart, suggesting potential bullish reversal and suggesting bears may be losing control and trend reversals favoring bulls could soon take place.
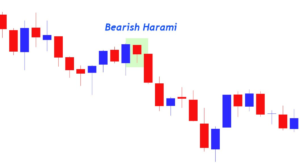
Bearish Harami :
- This pattern occurs when large bullish candles, representing strong buying pressure, are followed by smaller candles that may either bearish or bullish in terms of hue and movement typically smaller and engulfed entirely within the body of an earlier bullish candle signalling weakening buying momentum suggesting a potential bearish reversal is on its way an essential signal for traders as this indicates bulls may be ceding their dominance to form an upward trend instead.

Exploring Harami Cross Pattern :
- The Harami Cross pattern is a variation on the traditional Harami pattern that occurs when one or more candles in the pattern contain Doji candles, these symbolize indecision in the market, adding further significance to potential trend reversal events.
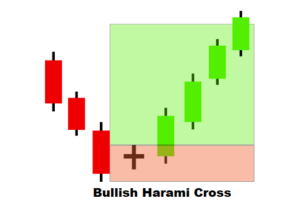
Bullish Harami Cross :
- This pattern can be divided into two categories.
- Bullish Harami Cross: This formation features a large bearish candle followed by a Doji candlestick appearing during an downtrend period.
- The presence of this form suggests selling pressure is diminishing and an expected bullish reversal may soon follow.
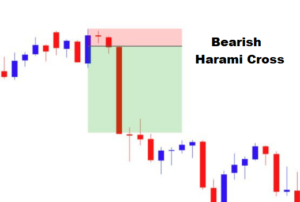
Bearish Harami Cross :
- This pattern occurs when a large bullish candle is followed by a Doji candlestick in an uptrend, signalling indecision among traders after such an impressive upward move and possible weakening buying momentum, leading to bearish reversals down the line.
Interpretation and Significance :
Harami and Harami Cross patterns are significant indicators of changing market sentiment.
- Their first large candle represents the trend that’s taking hold, while a second smaller one (Doji) suggests momentum loss is possible and that reversals may soon take place.
- However, it should be borne in mind that these patterns do not guarantee trend reversals, traders should rely on other technical indicators, such as volume, support and resistance levels or candlestick patterns for verification before making trading decisions based on Harami and Harami Cross patterns.

Identify Harami Patterns in Trading :
- Assess Market Trend: To effectively recognize Harami and Harami Cross patterns in trading, observe market trends first before searching for these patterns. Identify any current or emerging patterns before searching for ones with particular significance to you.
- Assess Candle Size: To effectively use candles in this setting, the first one must be significantly larger than any second candle, with its body completely covering that of its counterpart.
- Waiting for Confirmation : To accurately gauge trend reversals, wait for confirmation in terms of increased volume or additional reversal patterns in subsequent candles.
Real-World Examples :
How Harami and Harami Cross patterns perform across markets:
Example 1: Bullish Harami in Forex
- Whilst on an extended downtrend, EUR/USD formed a bullish Harami pattern on its daily chart after four candles had shown consecutive large bearish candles followed by smaller bullish ones, signalling potential trend reversal that was later confirmed with strong bullish movement in subsequent days.
Example 2: Bearish Harami Cross in Stocks
- A bearish Harami Cross pattern was identified on a weekly chart of a major technology stock, comprised of a large bullish candle followed by a Doji.
- Subsequently, the stock experienced significant declines that confirmed its bearish signal sent out by this signal from Harami Cross.
Example 3: Bullish Harami Cross in Crypto
- On the 4-hour chart of Bitcoin, a bullish Harami Cross was observed.
- The pattern emerged following a sharp decline, with large bearish candles followed by Doji formations, before witnessing an impressive bullish rally that showcased its predictive ability in such volatile markets as cryptocurrency.

Conclusion and Next Steps :
Harami and Harami Cross patterns can provide technical analysts and traders with powerful tools for identifying potential trend reversals.
- By understanding their formation and significance, traders can make more informed decisions and increase their odds of success.
- Mastering candlestick patterns is an ongoing journey, traders should continue studying, practicing and honing their skills at recognizing and interpreting these patterns.
Harami and Harami Cross patterns provide traders with a more complete picture of the market that may lead to improved trading outcomes.
- Take action now by including Harami and Harami Cross patterns into your trading strategy.
- Keep an eye out for them across markets and time frames you favor, and practice recognizing them live.
With dedication and experience, harness the power of these patterns to make better trading decisions that increase profitability.

Frequently Asked Questions :
What Is a Candlestick Pattern in Trading?
Answer :
- Candlestick patterns are visual depictions of price movement within financial markets that allow traders to predict future price movement using past patterns as reference points.
How Does the Harami Pattern Indicate Trend Reversals?
Answer :
- The Harami pattern signals an impending trend reversal by showing up as two consecutive small candles following one large one, suggesting a decrease in momentum for current trend.
What Is the Difference Between a Bullish Harami and Bearish Harami?
Answer :
- A Bullish Harami typically occurs during a downward trend and signals its potential reversal upward, while Bearish Harami occurs in an upward trend and implies potential downward reversals.
Why Is The Harami Cross More Significant?
Answer :
- A Harami Cross with its associated Doji represents market indecision, lending additional evidence of weakening trends.
- This pattern adds extra evidence that could indicate weakening trends within an overall trending trend.
Are Harami and Harami Cross Patterns Appropriate in All Markets?
Answer :
- Yes, these Harami and Harami Cross patterns can be utilized across markets like forex, stocks, and cryptocurrency to provide a useful technical analysis tool.
Will Additional Indicators Help me Trade Harami and Harami Cross Patterns Successfully?
Answer :
- Harami and Harami Cross patterns may indicate potential market reversals by themselves; however, using other indicators for confirmation, such as volume analysis or candlestick formations can greatly enhance trading decisions.
Are Harami Patterns Appropriate for Beginners?
Answer :
- Yes, Harami patterns can be easily identified by traders of all levels, from beginners to experts.
How Does Volume Impact Harami Patterns?
Answer :
- Volume can act as an important indicator in trading Harami patterns, an increase in volume after seeing one can strengthen signals of trend reversals and may indicate when trading them is about to occur.
Which Time Frames Work Best When It Comes to Recognizing Harami and Harami Cross Patterns?
Answer :
- Harami and Harami Cross patterns can be recognized on any time frame, with greater significance being noted on higher time frames such as daily or weekly charts.
Can Harami Patterns Predict Reversal Trend Duration?
Answer :
- Unfortunately not; Harami patterns provide only indication of potential trend reversals, they do not give information regarding its duration or strength.


